- Optimism price shows a clear bullish divergence on the daily chart, forecasting a potential 30% run-up to $1.82.
- Massive spikes in Whale Transaction Count combined with accumulation patterns suggest OP holders are expecting a bullish future.
- A daily candlestick close below the $1.34 support level will invalidate the bullish thesis and potentially trigger a correction to $1.06.
Optimism (OP) price shows strength despite the market-wide sell-off on June 5. Additionally, the technicals and on-chain metrics both strongly suggest a bullish future for OP holders.
Also read: Apple staying mum on Metaverse at WWDC wipes out Metaverse tokens’ value by 10%
Optimism price ready to break free
Optimism (OP) price slid 14% on June 5 but soon recovered and produced a daily candlestick close above $1.34. This move that collected the sell-stop liquidity showed an impressive recovery, which is the first sign of willing OP buyers in the market.
Additionally, the Relative Strength Index (RSI) and the Awesome Oscillator (AO) indicators display higher lows, indicating rising bullish momentum for Optimism price. Combining the indicators’ rising momentum with OP, which has produced lower lows, reveals a bullish divergence.
This technical formation is obtained when the underlying asset produces a lower low while the momentum indicators set up higher lows. The non-conformity is termed bullish divergence and often leads to a massive spike in the underlying asset’s price. In this case, it indicates that Optimism price is ready for an explosive move.
A recovery rally above $1.48 is the second sign that bulls are at it. A bounce off the aforementioned level will propel Optimism price to the next target at $1.82. In total, this move would constitute a 31% gain from the current position of $1.39.
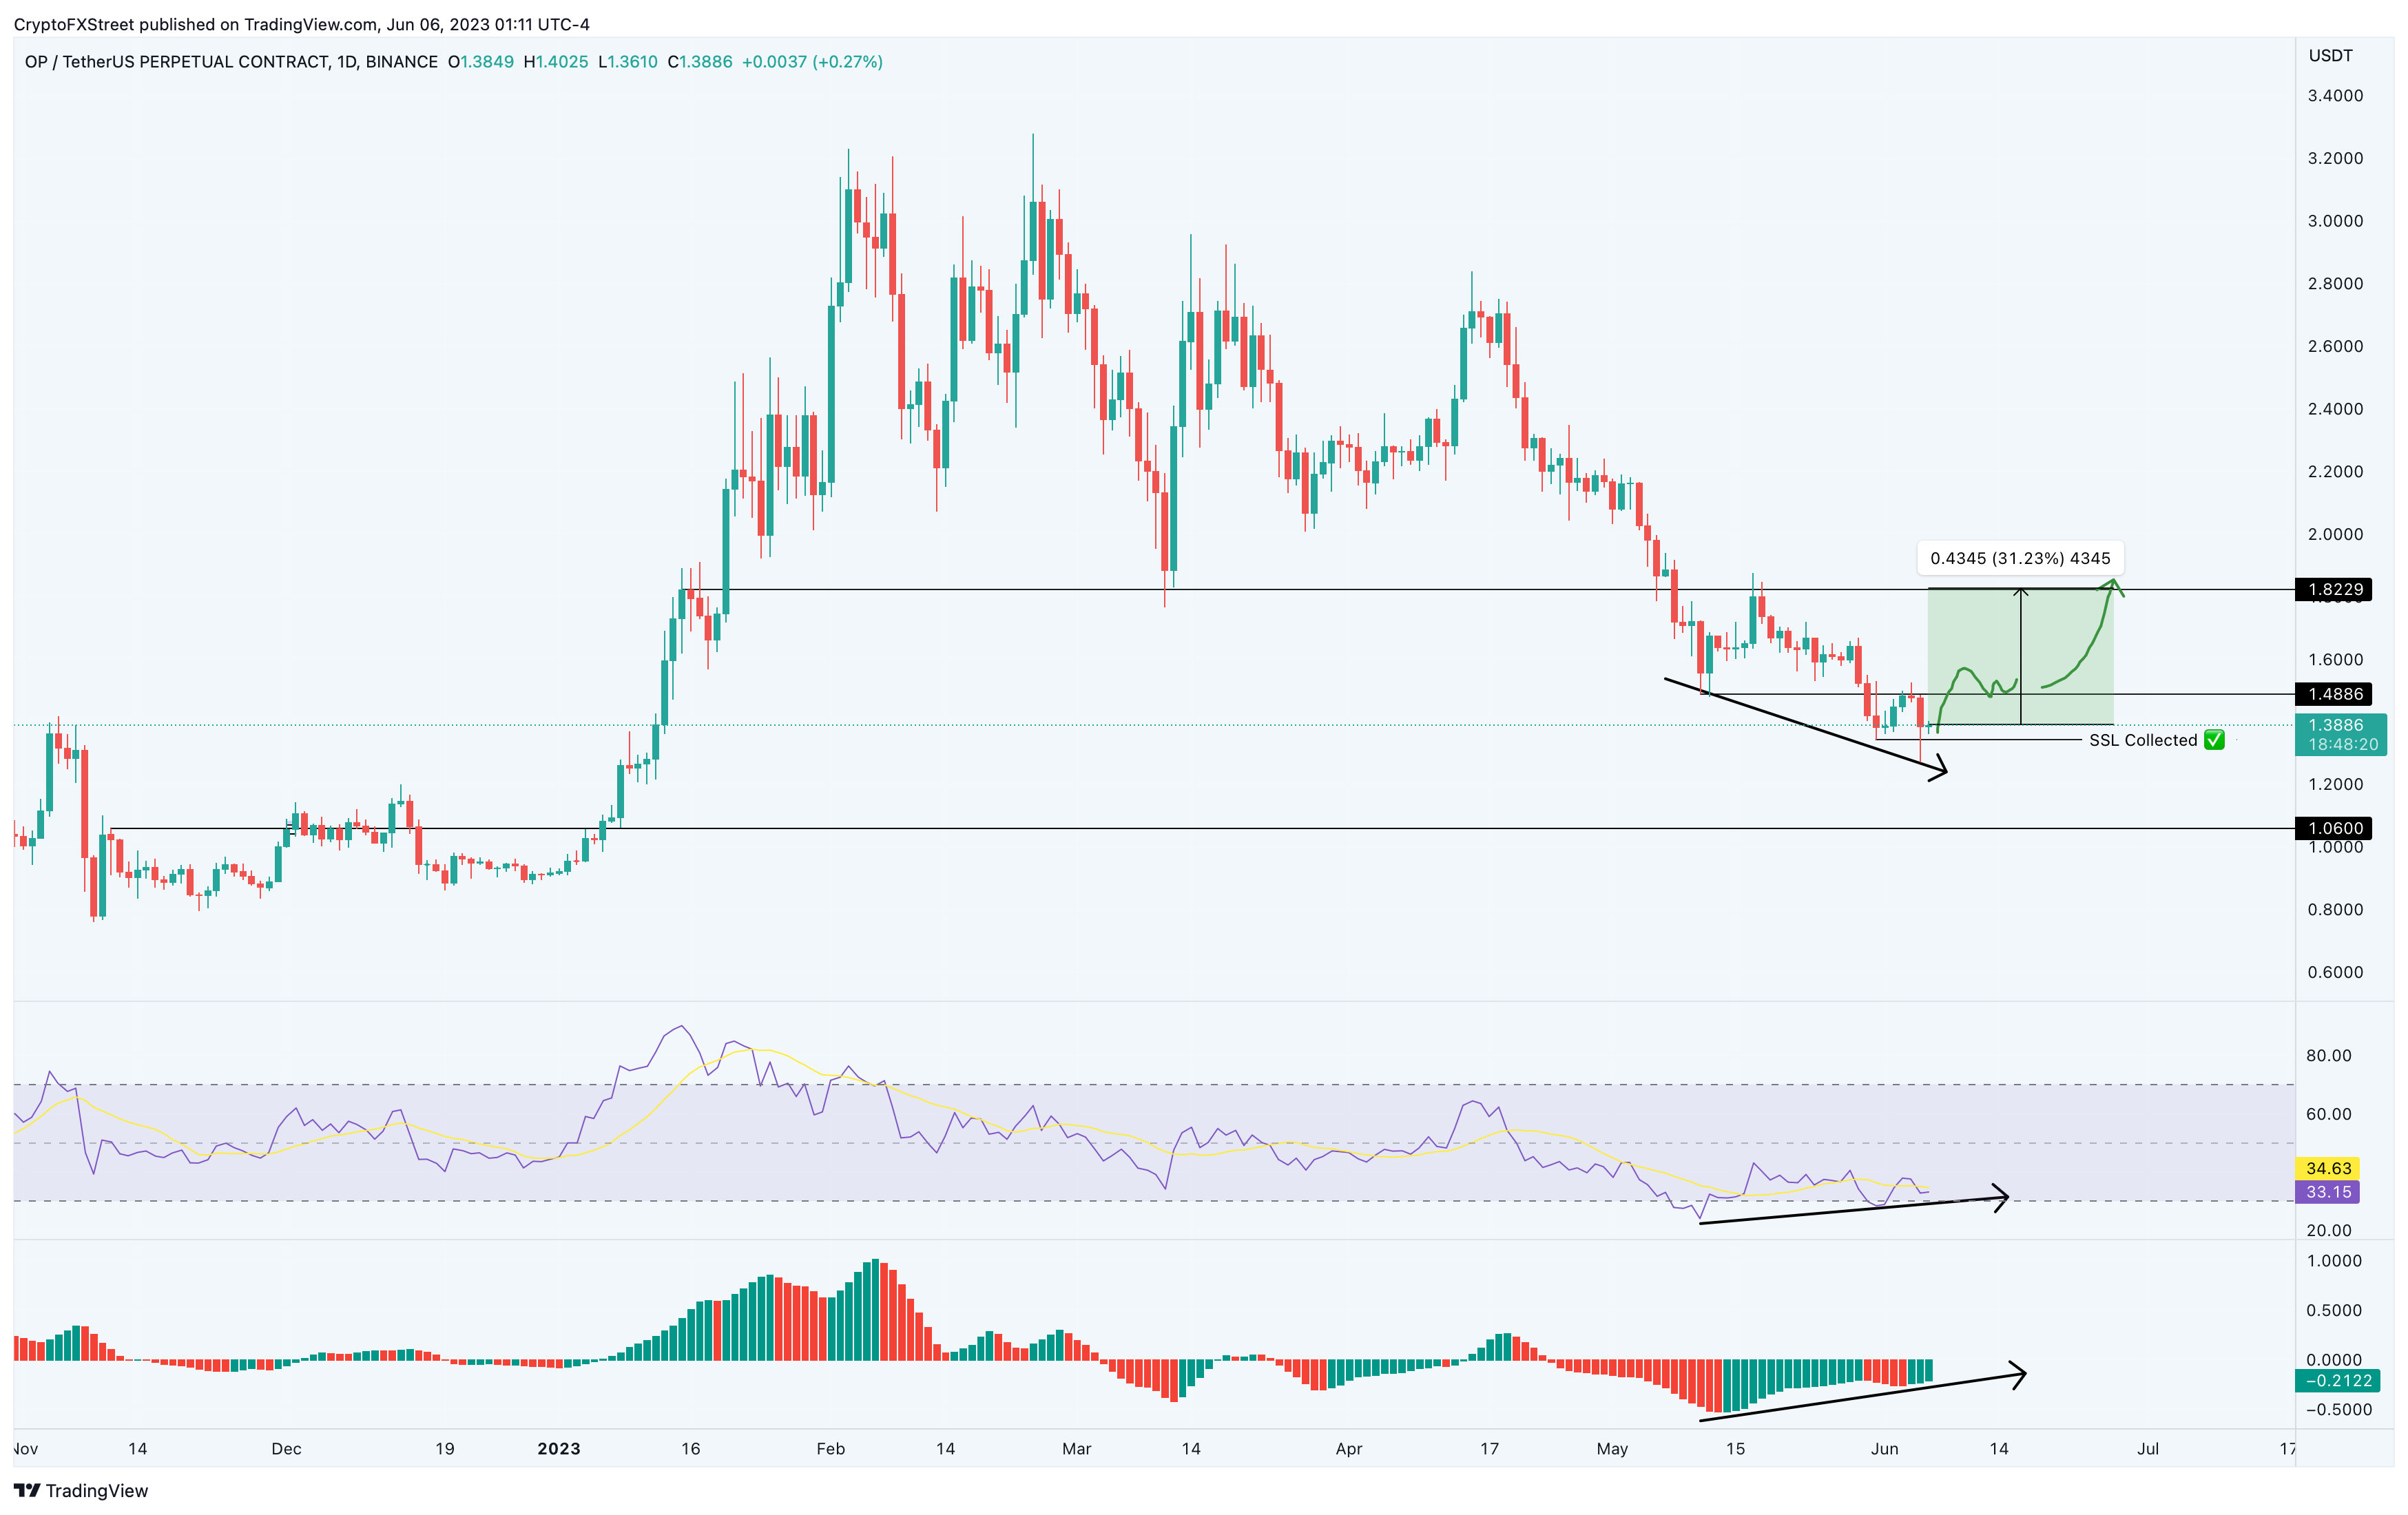
OP/USDT 1-day chart
On-chain metrics remain optimistic
One of the most important metric is the Whale Transaction Count. As the name indicates, this index tracks transactions worth more than $100,000. The yellow bars are transactions worth more than $100,000 and the blue bars track transactions worth over $1 million. As seen in the chart, there was a massive spike on May 31 and June 1 after Optimism price dropped 24%. Clearly, this index can be interpreted as whales buying the dip.
 [10.41.19, 06 Jun, 2023]-638216259079519758.png)
OP Whale Transaction Count chart
Furthermore, the Supply Distribution chart shows that whales holding 100,000 to 1 million OP tokens have been on a buying spree since May 14. Their number has increased from 21 to 69, denoting a 228% spike.
Similarly, addresses holding 100,000 to 1 million OP tokens have jumped from 54 on May 30 to 78 as of June 6. These patterns suggest that they are expecting a bullish future for Optimism price.
 [10.14.35, 06 Jun, 2023]-638216259075550274.png)
OP Supply Distribution chart
While all signs point to a bullish future for Optimism (OP) price, investors need to be cautious due to the delicate nature of the lawsuit brought forward by the US Securities and Exchange Commission (SEC) against Binance. The initial reaction caused $311 million in liquidations, and the after-effects of the same could continue to pressure the Bitcoin price lower.
In such a case, a daily candlestick close below the $1.34 support level will create a lower low and invalidate the bullish thesis and potentially trigger a correction to $1.06.
Information on these pages contains forward-looking statements that involve risks and uncertainties. Markets and instruments profiled on this page are for informational purposes only and should not in any way come across as a recommendation to buy or sell in these assets. You should do your own thorough research before making any investment decisions. FXStreet does not in any way guarantee that this information is free from mistakes, errors, or material misstatements. It also does not guarantee that this information is of a timely nature. Investing in Open Markets involves a great deal of risk, including the loss of all or a portion of your investment, as well as emotional distress. All risks, losses and costs associated with investing, including total loss of principal, are your responsibility. The views and opinions expressed in this article are those of the authors and do not necessarily reflect the official policy or position of FXStreet nor its advertisers. The author will not be held responsible for information that is found at the end of links posted on this page.
If not otherwise explicitly mentioned in the body of the article, at the time of writing, the author has no position in any stock mentioned in this article and no business relationship with any company mentioned. The author has not received compensation for writing this article, other than from FXStreet.
FXStreet and the author do not provide personalized recommendations. The author makes no representations as to the accuracy, completeness, or suitability of this information. FXStreet and the author will not be liable for any errors, omissions or any losses, injuries or damages arising from this information and its display or use. Errors and omissions excepted.
The author and FXStreet are not registered investment advisors and nothing in this article is intended to be investment advice.
Recommended Content
Editors’ Picks
Ripple update: XRP shows resilience in recent crypto market sell-off
Ripple's XRP is up 6% on Tuesday following a series of on-chain metrics, which reveals investors in the remittance-based token held onto their assets despite the wider crypto market sell-off last week.
Floki DAO floats liquidity provisioning for a Floki ETP in Europe
Floki DAO — the organization that manages the memecoin Floki — has proposed allocating a portion of its treasury to an asset manager in a bid to launch an exchange-traded product (ETP) in Europe, allowing institutional investors to gain exposure to the memecoin.

Six Bitcoin mutual funds to debut in Israel next week: Report
Six mutual funds tracking the price of bitcoin (BTC) will debut in Israel next week after the Israel Securities Authority (ISA) granted permission for the products, Calcalist reported on Wednesday.

Crypto Today: BTC hits new Trump-era low as Chainlink, HBAR and AAVE lead market recovery
The global cryptocurrency market cap shrank by $500 billion after the Federal Reserve's hawkish statements on December 17. Amid the market crash, Bitcoin price declined 7.2% last week, recording its first weekly timeframe loss since Donald Trump’s re-election.

Bitcoin: 2025 outlook brightens on expectations of US pro-crypto policy
Bitcoin price has surged more than 140% in 2024, reaching the $100K milestone in early December. The rally was driven by the launch of Bitcoin Spot ETFs in January and the reduced supply following the fourth halving event in April.

Best Forex Brokers with Low Spreads
VERIFIED Low spreads are crucial for reducing trading costs. Explore top Forex brokers offering competitive spreads and high leverage. Compare options for EUR/USD, GBP/USD, USD/JPY, and Gold.