Optimism boosts Ethereum adoption despite ETH price downtrend
- Ethereum price closes below the $3,000 psychological level for the first time in 45 days.
- On-chain metrics hint that the current sell-off is driven by short-term holders.
- Transactional data supports a move to $2,500 as the 365-day MVRV adds tailwind to this bearish idea.

Ethereum price has not had the best past two weeks. Not only has ETH sliced through significant support levels, but it has also shattered a crucial psychological level. While things look dire, on-chain metrics alleviate the pain, bringing hope that an upswing is not outside the realm of possibility.
Thailand embraces ETH, Optimism takes scaling to a new level
The Thailand Securities & Exchange Commission (SEC) sanctioned a license to Fraction, a Hong Kong-based fintech firm, on September 16. This development is a new step in embracing cryptocurrencies, especially ETH.
Fraction Group, which owns Fraction, has obtained the SEC’s Initial Coin Offering (ICO) Portal license. The company added that it plans to list “iconic real estate properties in partnership with leading developers Magnolia Quality Development Corporation, Charn Issara and Nirvana Daii.”
On a similar note, Optimism, a layer-2 scaling solution backed by Ethereum Foundation, announced on September 17 a new update that will allow developers and platforms to launch Ethereum-native protocols on its network with a single click.
The blog adds,
By precisely enforcing the Ethereum Yellow Paper, anyone who has written code targeting Geth can now deploy without change — even for advanced features like traces and gas. The upgrade removes our custom compiler, and over 25,000 lines of other code, in favor of simply using what already exists.
While the adoption of ETH and DeFi are going splendidly, ETH price continues to make lower lows as the market is stuck in a downswing.
Ethereum price hopes for a miracle
Ethereum price has crashed 33% over the past 16 days and shows no signs of slowing as it hovers below the $3,000 psychological level. If the selling pressure continues, ETH will likely tag the demand zone, ranging from $2,442 to $2,605.
Investors can expect a resurgence of buyers at this support area and a potential trend reversal. However, if the bulls fail to pull through and produce a decisive close below $2,442, it will indicate increased seller activity.
Such a development will most likely knock the smart contract token down to $2,321.
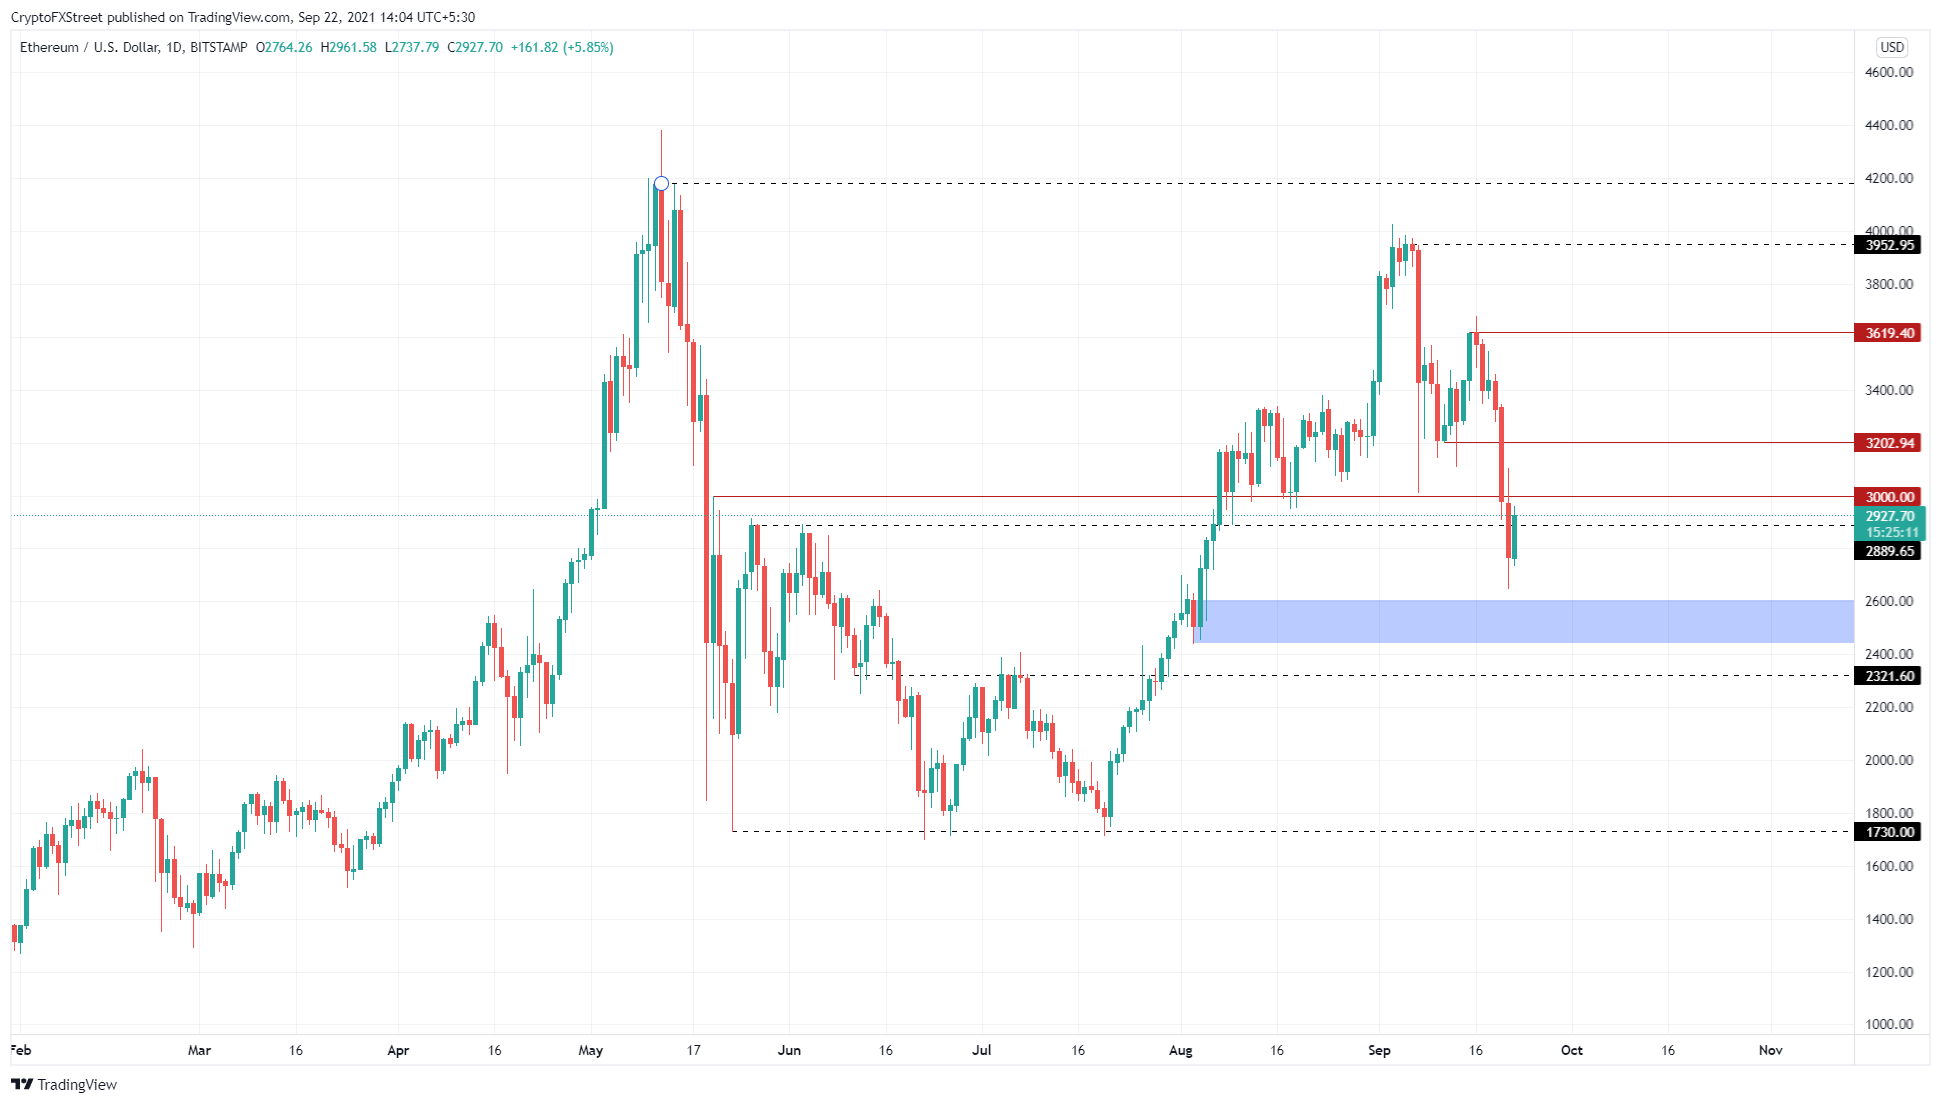
ETH/USD 1-day chart
Supporting the descent to $2,500 or $2,321 is IntoTheBlock’s Global In/Out of the Money (GIOM) model. This on-chain metric suggests that a breakdown of $2,875 could drag Ethereum price to $2,511.
Here, roughly 3.64 million addresses purchased nearly 9.33 million ETH. Therefore, the market participants in this area could probably absorb the selling pressure by adding more to their holdings.
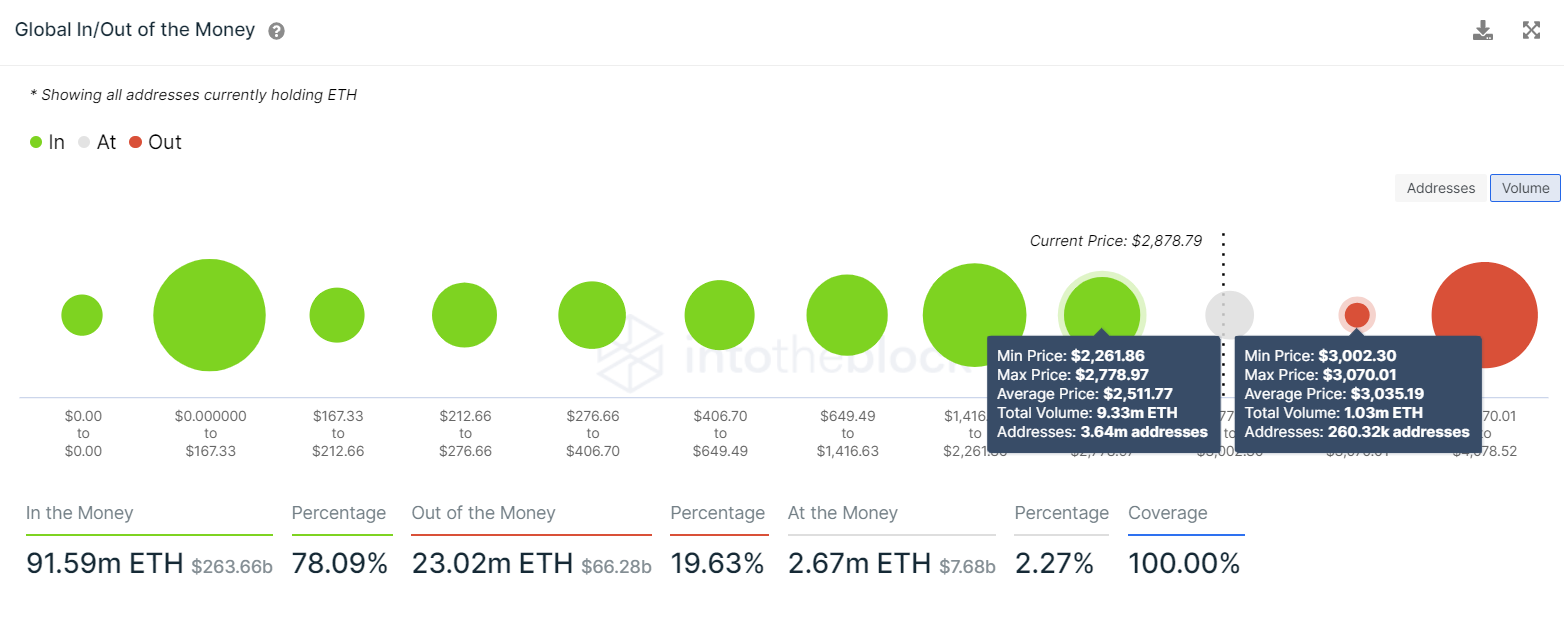
ETH GIOM chart
Moreover, the current sell-off seems to be driven by short-term holders, as seen in the Net Realized Profit/Loss indicator (NRPL). This fundamental index computes the average profit/loss of addresses of ETH that changes hands on a daily basis.
On September 21, this indicator showed that an estimated 35 million worth of ETH was transferred at a loss.
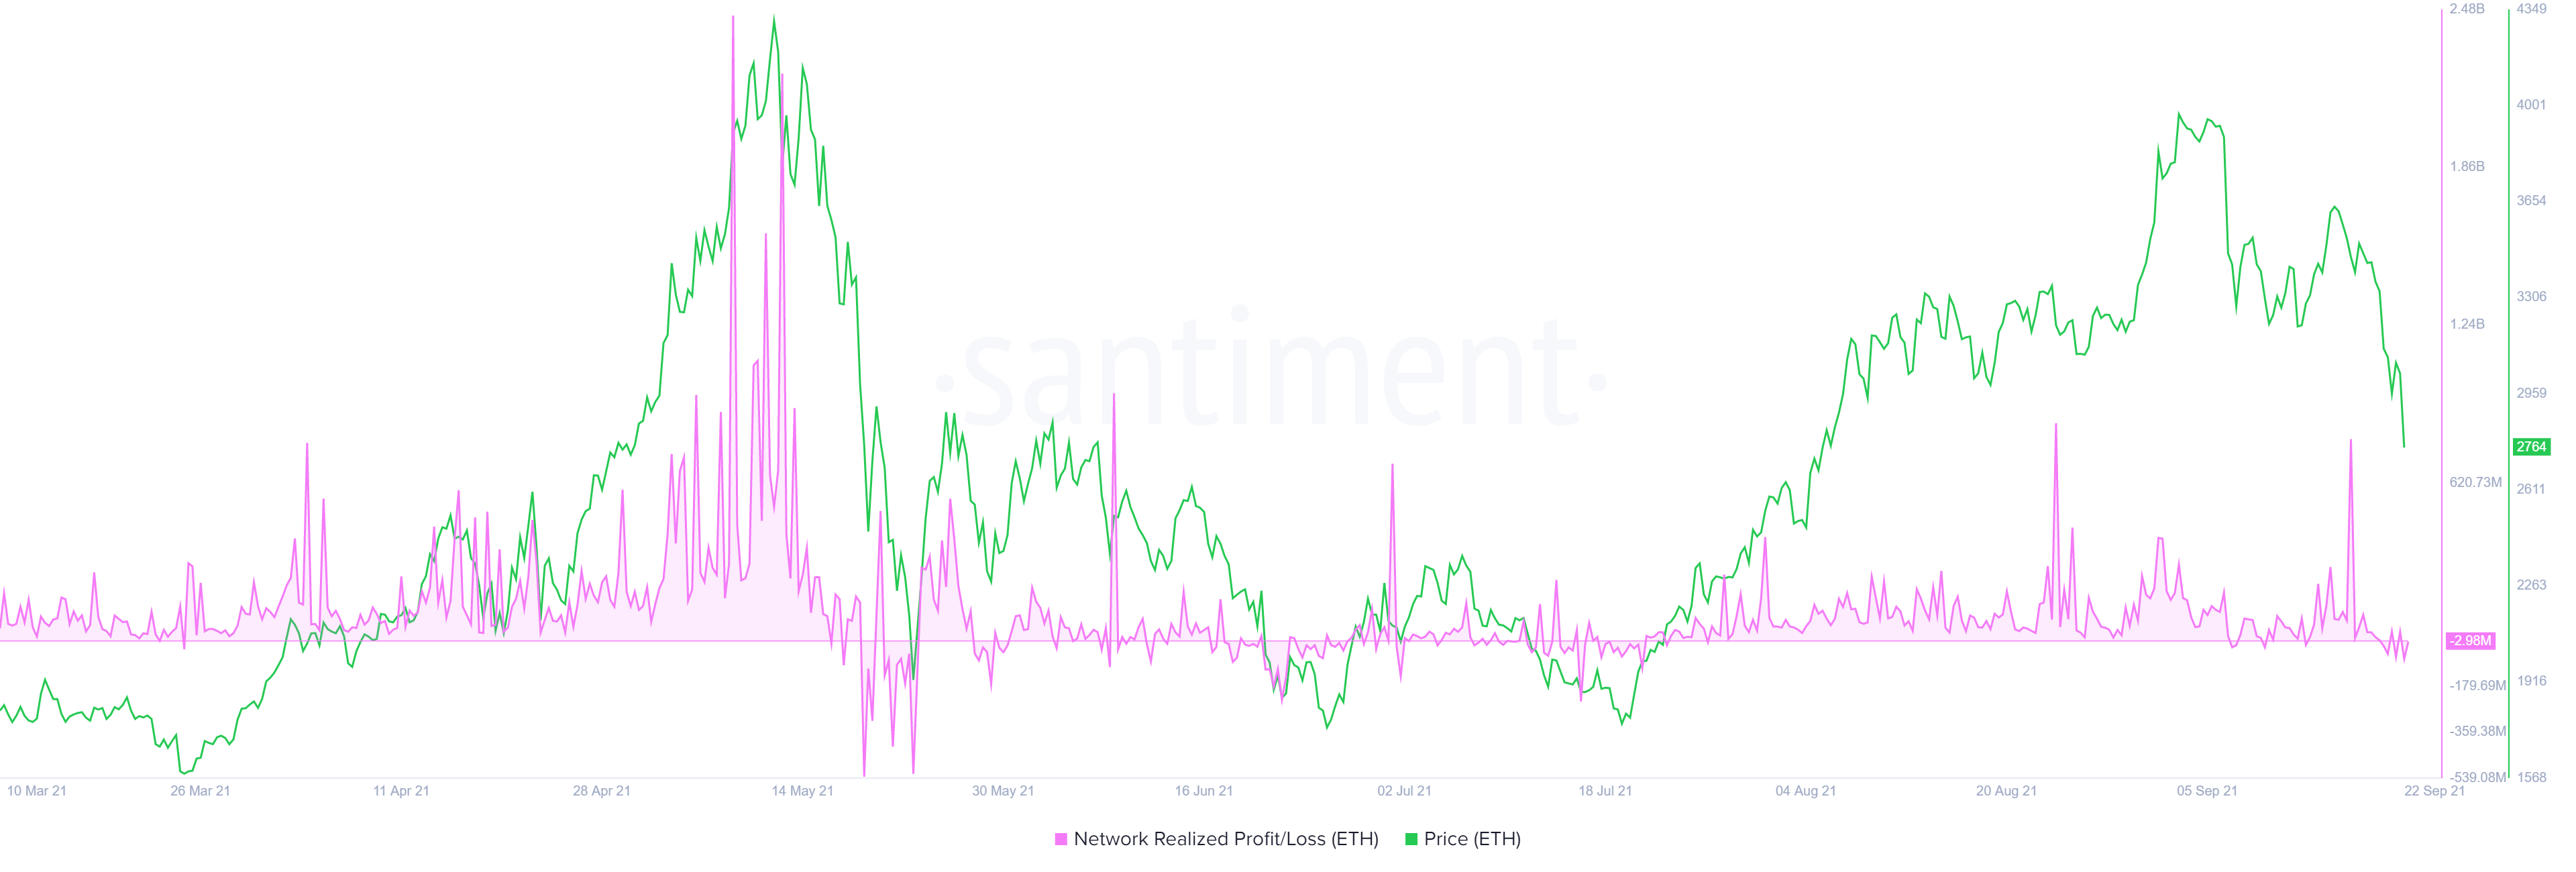
ETH NRPL chart
The weak hand shakeout that ETH is experiencing might be exacerbated as the 365-day Market Value to Realized Value (MVRV) model is still hovering around 33%, hinting at more room to the downside.
This on-chain indicator is used to measure the average profit/loss of investors that purchased ETH over the past year. A higher value often indicates that if those market participants book profit, there is a chance of a sell-off.
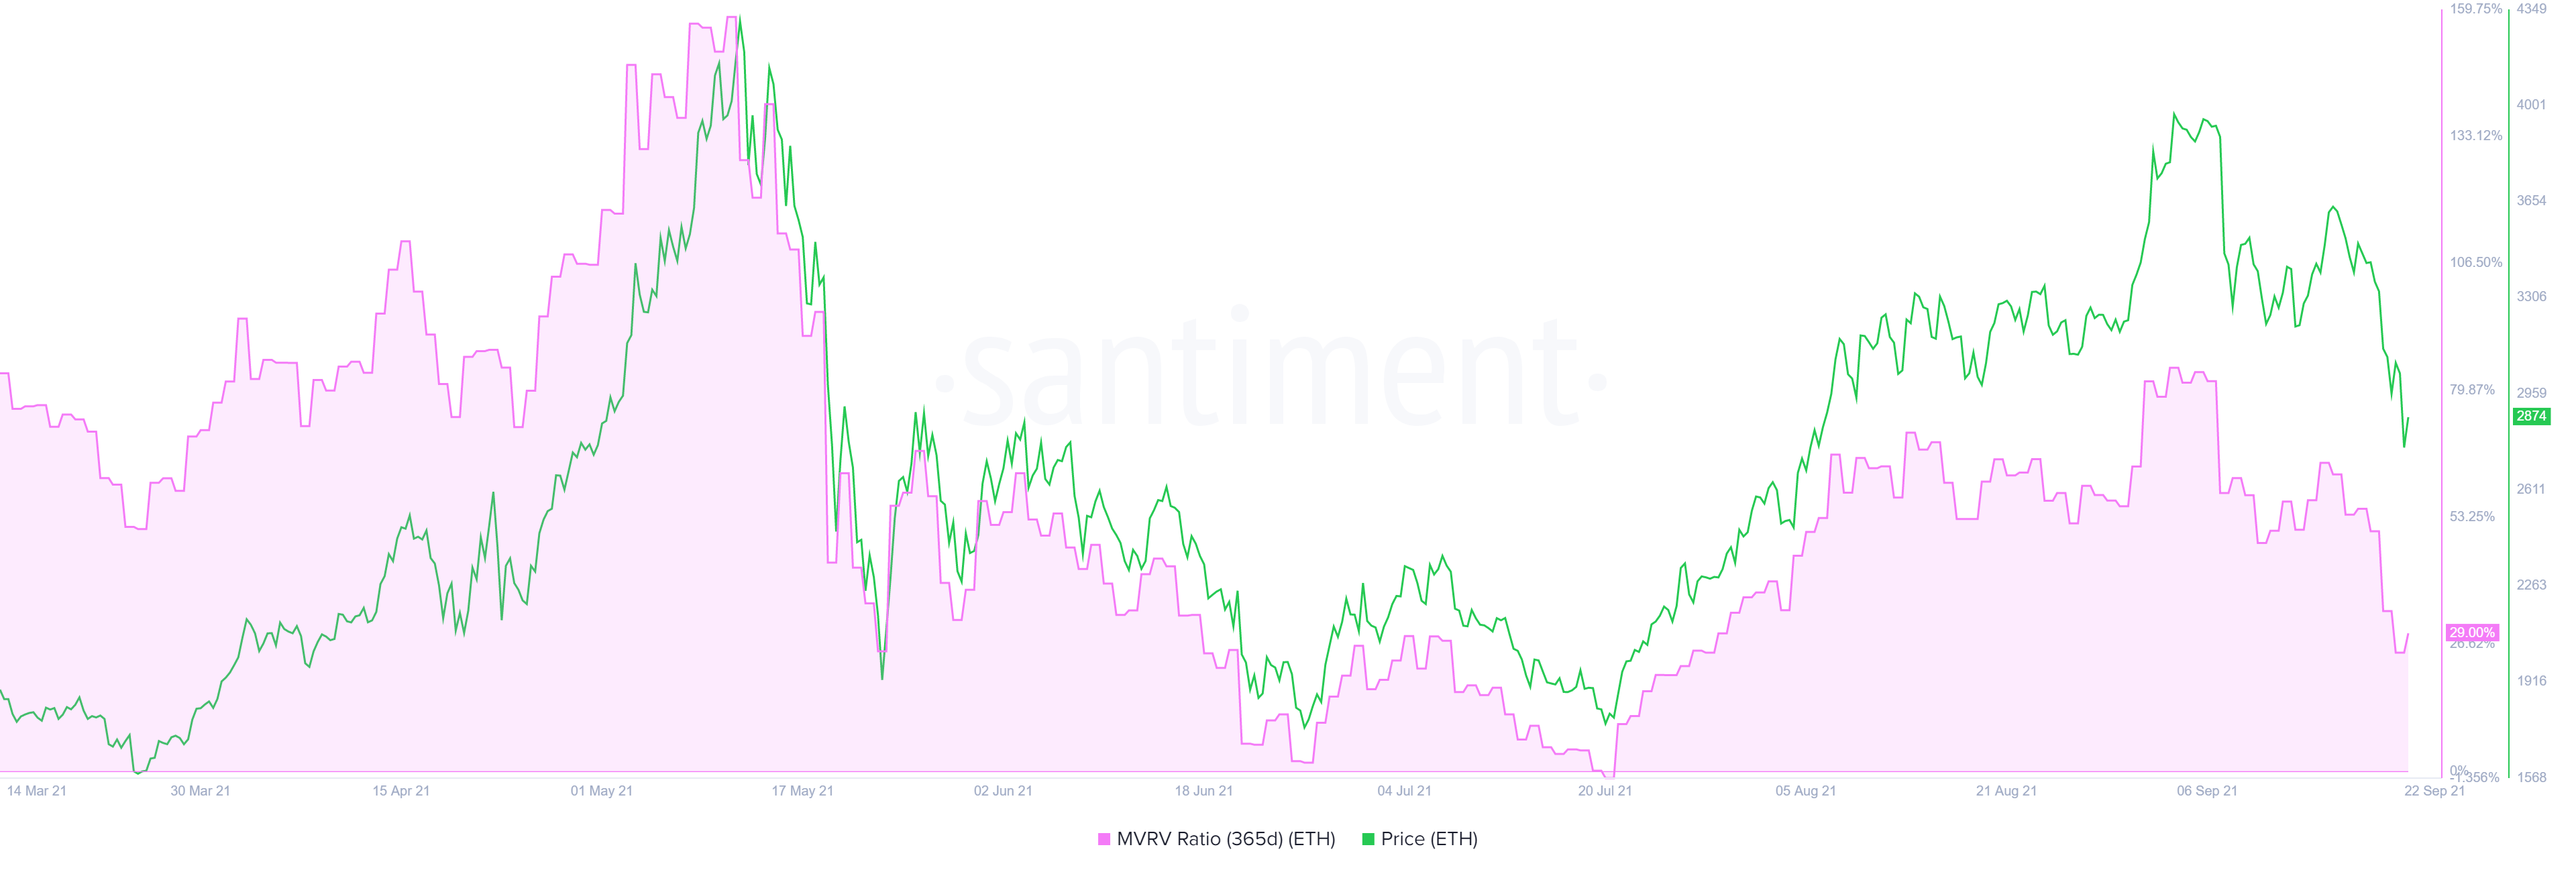
ETH 365-day MVRV chart
Moreover, the supply of ETH on exchanges has gradually increased from 19.32 million to 19.47 million. Roughly 150,000 ETH found a way into centralized entities, which could translate into selling pressure.

ETH supply on exchanges chart
Therefore, a downswing here seems like a high probability setup, especially considering the big crypto’s weak structure. If BTC continues to deteriorate, Ethereum price and altcoins will follow suit.
On the other hand, if Bitcoin price improves and starts to shatter resistance levels to reclaim $50,000, ETH will also flip $3,000 into a support floor. Such a move might be inviting sidelined investors to jump on the bandwagon, pushing Ethereum price to $3,202
A decisive close above this resistance level will invalidate the bullish thesis and trigger a rally to subsequent ceilings at $3,600 and $4,000.
Author

Akash Girimath
FXStreet
Akash Girimath is a Mechanical Engineer interested in the chaos of the financial markets. Trying to make sense of this convoluted yet fascinating space, he switched his engineering job to become a crypto reporter and analyst.


