- Bitcoin on-chain metrics indicate that a sell-off is in sight as long-term bitcoin holders seek to take profit.
- Institutional investors become more eager to buy more Bitcoin as they prepare to exploit possible market sell-off.
- Bitcoin price charts reinforce the bearish case showing it may retest $16,000.
Onchain data reveal Bitcoin price may be poised for weeks of consolidation or considerable bearish dip at worst. Meanwhile, corporate investors get more desperate to take advantage of any imminent dip.
Onchain record spell brief doom for bitcoin price while investors seek to utilize the dip
Data from on-chain market analyst, Glassnode, shows that long-term Bitcoin holders are taking short positions to realize profit.
While this unfolding event might seem disturbing, it is important to note that it provides a bullish outlook for Bitcoin price in the long run. Historical data presents this as one among the many occurrences that preceded previous bull cycles, pointing to the fact that the imminent dip is a healthy market correction.
According to the trend, a sell-off from long-term holders leads to a redistribution of Bitcoin's circulating supply, thereby giving room for more retail investors' entry just before the rallies.
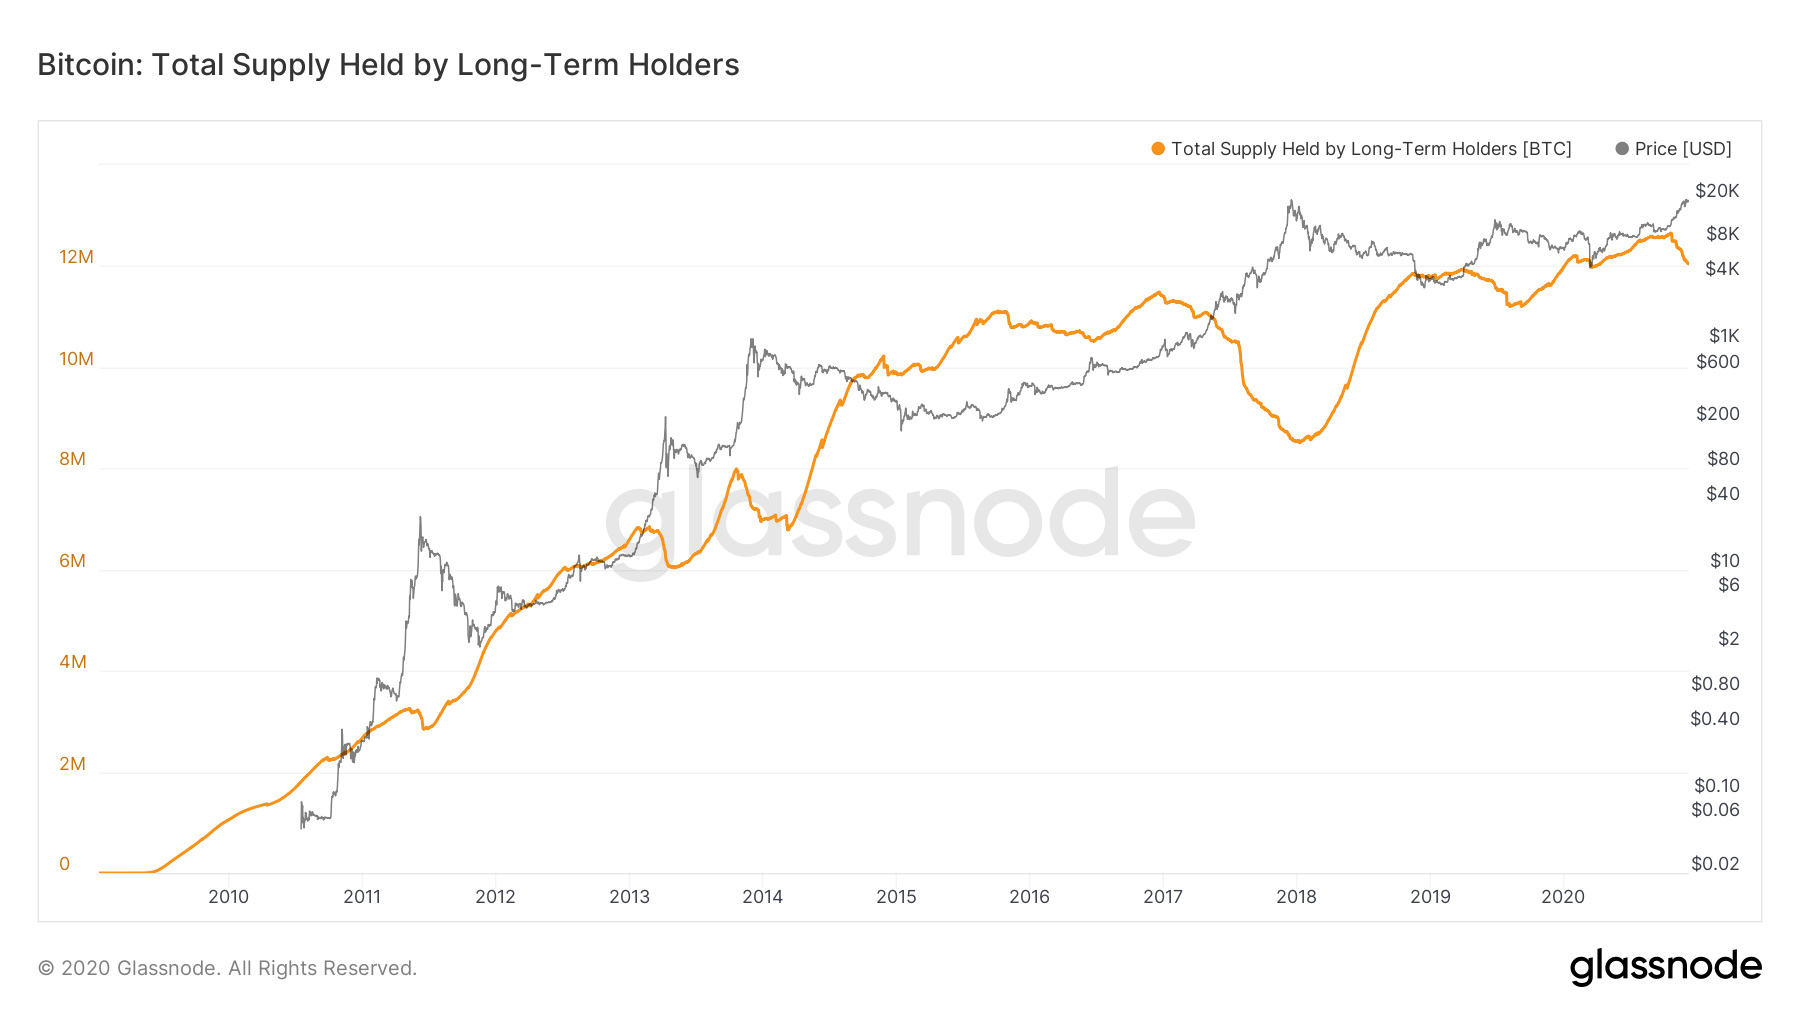
Total Bitcoin supply from long term holders
As the market anticipates moments of intermittent sell-off, corporate investors are growing an insatiable appetite for Bitcoin as they position themselves to take advantage of any downward trend.
Microstrategy, which currently owns over 40,000 BTC, remains among the institutional investors with the highest interest in Bitcoin. The business analytics firm has announced that it aims to raise $400 million through sales of promissory notes, which would be used to buy Bitcoin.
Bitcoin may retest $16,000 before making another upswing
Meanwhile, the activities from institutional investors and long-term Bitcoin holders are expected to cause significant price action in the short term.
Bitcoin price in a broader time frame remains bullish as it sits at $18,870 at the time of writing. As shown on the weekly chart, there is potential for a price consolidation similar to August when it made a 30% correction before a rebound to $19,500.
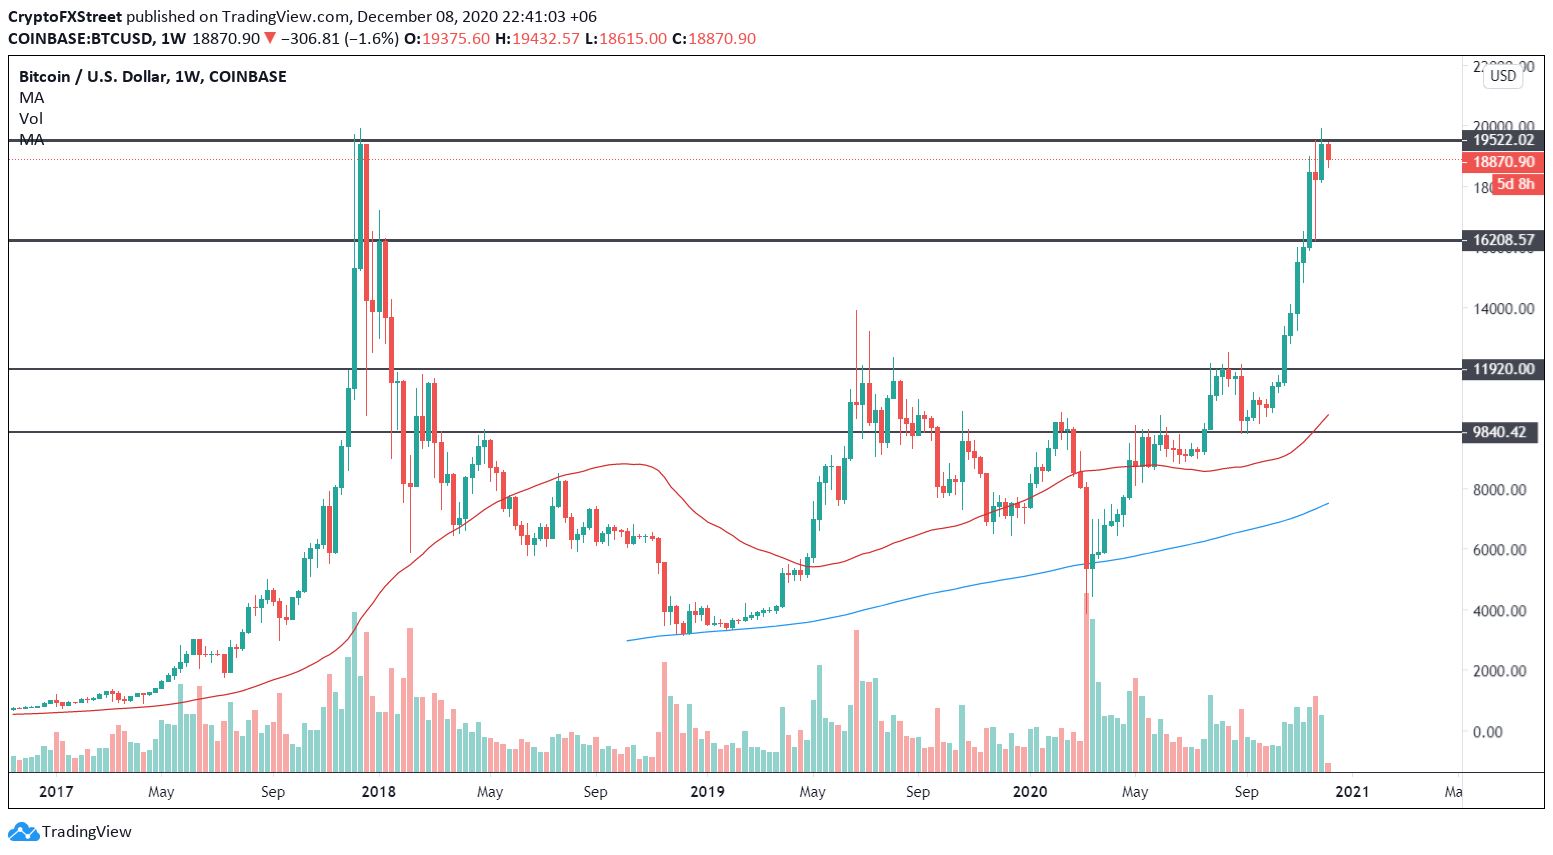
BTC/USD Weekly chart
The likelihood of another reaccumulation could lead to another period of volatility followed by a downward price action that would see prices slice through $16,000, creating a potential entry-level within this zone.
Information on these pages contains forward-looking statements that involve risks and uncertainties. Markets and instruments profiled on this page are for informational purposes only and should not in any way come across as a recommendation to buy or sell in these assets. You should do your own thorough research before making any investment decisions. FXStreet does not in any way guarantee that this information is free from mistakes, errors, or material misstatements. It also does not guarantee that this information is of a timely nature. Investing in Open Markets involves a great deal of risk, including the loss of all or a portion of your investment, as well as emotional distress. All risks, losses and costs associated with investing, including total loss of principal, are your responsibility. The views and opinions expressed in this article are those of the authors and do not necessarily reflect the official policy or position of FXStreet nor its advertisers. The author will not be held responsible for information that is found at the end of links posted on this page.
If not otherwise explicitly mentioned in the body of the article, at the time of writing, the author has no position in any stock mentioned in this article and no business relationship with any company mentioned. The author has not received compensation for writing this article, other than from FXStreet.
FXStreet and the author do not provide personalized recommendations. The author makes no representations as to the accuracy, completeness, or suitability of this information. FXStreet and the author will not be liable for any errors, omissions or any losses, injuries or damages arising from this information and its display or use. Errors and omissions excepted.
The author and FXStreet are not registered investment advisors and nothing in this article is intended to be investment advice.
Recommended Content
Editors’ Picks
Bitcoin and altcoins are hit by biggest crypto hack in history
Bitcoin holds steady above $95,000, while crypto market capitalization excluding BTC decreases to $1.18 trillion on Monday. Analysts note that institutional interest in Bitcoin is likely overestimated through inflow data since it includes nearly 56% of BTC tied to arbitrage strategies.
Bitcoin Price Forecast: BTC standoff continues
Bitcoin has been consolidating between $94,000 and $100,000 since early February. Amid this consolidation, investor sentiment remains indecisive, with US spot ETFs recording a $540 million net outflow last week, signaling institutional demand weakness.
Solana drops below $160, liquidating $26 million in leverage as negative funding rate weighs in
Solana price extends its decline and trades around $160 on Monday after falling over 11% last week. The recent correction in SOL has triggered a wave of over $26 million in liquidations in the last 24 hours and $110 million last week.
Dogecoin Price Forecast: DOGE bears remain strong despite Elon Musk’s endorsement
Dogecoin extends its decline, trading around $0.23 on Monday after falling 8.55% last week. Coinglass’ long-to-short ratio for DOGE reads below one, indicating more traders are betting for a correction while the technical outlook projects a pullback toward the $0.20 level.
Bitcoin: BTC demand and liquidity conditions remain weak
Bitcoin price has been consolidating between $94,000 and $100,000 since early February, hovering around $98,000 at the time of writing on Friday. Despite this consolidation, US Bitcoin spot ETFs data recorded a total net outflow of $489.60 million until Thursday, hinting signs of weakness among institutional investors.
The Best brokers to trade EUR/USD
SPONSORED Discover the top brokers for trading EUR/USD in 2025. Our list features brokers with competitive spreads, fast execution, and powerful platforms. Whether you're a beginner or an expert, find the right partner to navigate the dynamic Forex market.