- Ocean Protocol price breaks out of a head-and-shoulder pattern, hinting at a 61% crash to $0.143
- OCEAN could slide to $0.246 if sellers push past the 200-day EMA support at $0.287.
- A daily candlestick close above the neckline at $0.350 will invalidate the bearish thesis.
Ocean Protocol (OCEAN) price took to an uptrend in early February, rising significantly during the first week before profit-takers interrupted the rally. The token then started a downtrend, losing all the ground covered in that month by early March. A bullish attempt to raise OCEAN’s market value has been impeded by dark clouds hanging above altcoins.
Also read: Mapping out Bitcoin's HTF levels and trade setups for March 2023 [Video]
Ocean Protocol price could drop to December 2022 lows
Ocean Protocol price blasted below the 50-day Exponential Moving Average (EMA) at $0.374 on March 6, losing 17.05% to find support at the current price of $0.309. The token’s price action since late January has formed a head and shoulder chart pattern. This technical formation is a bearish pattern consisting of three tops with a higher high in the middle (head) and a line linking the two valleys known as the neckline.
Ocean Protocol price confirmed the pattern when it broke the neckline at $0.350 and produced a twelve-hour candlestick close below it on March 8 trading session. The bearish breakout paved the way for the target of the chart pattern at around $0.140, which is 61.58% below the current levels. Notably, the target is estimated by measuring the height between the neckline and the head, then projecting it downwards.
Before hitting the target, the Ocean Protocol price must overcome the support presented by the 200-day EMA at $0.287, followed by the $0.246 support level.
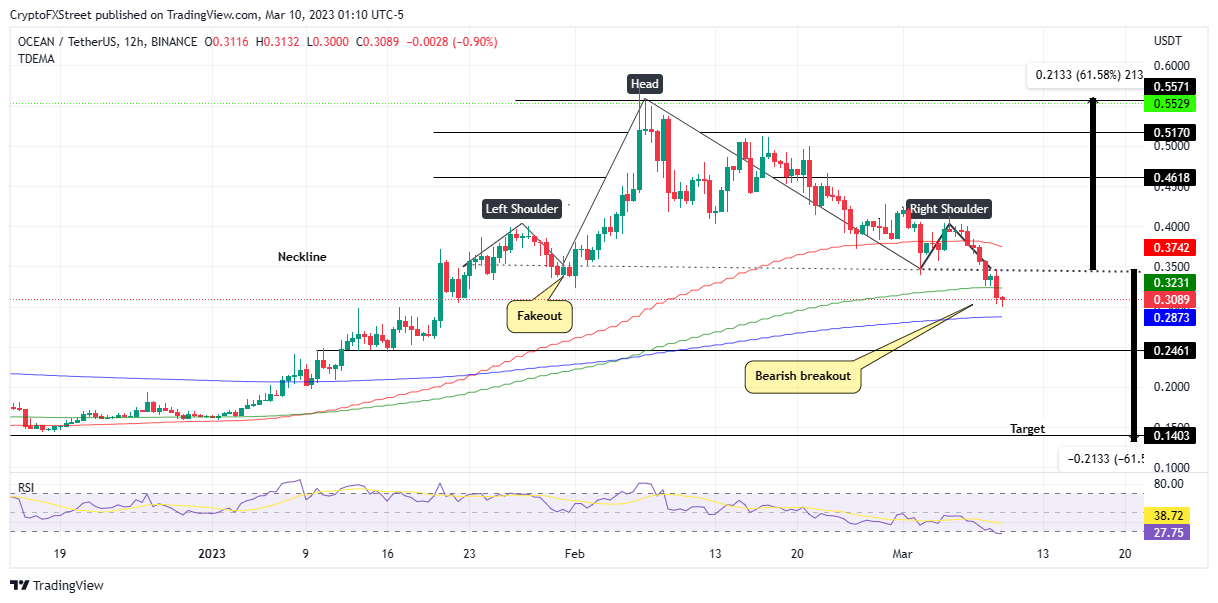
OCEAN/USDT 12-hour chart
On the other hand, conservative traders looking for additional confirmation could see this as an entry point to buy OCEAN at a fair market value of $0.3231?. A daily candlestick close above $0.350 will invalidate the head-and-shoulders bearish thesis.
Such a move would bounce the Ocean Protocol price to confront the immediate resistance presented by the 100-day EMA at $0.323. An increase in buying pressure from this level could send Ocean Protocol price past the neckline to fight the next roadblock offered by the 50-day EMA at $0.374.
Northward, OCEAN would need to break down the $0.461 and $0.517 resistance levels before regaining its $0.557 at the head of the governing chart pattern.
Nevertheless, given the overhead pressure due to the EMAs and the general bearish sentiment in the market, chances of a trend reversal remain slim for now.
Information on these pages contains forward-looking statements that involve risks and uncertainties. Markets and instruments profiled on this page are for informational purposes only and should not in any way come across as a recommendation to buy or sell in these assets. You should do your own thorough research before making any investment decisions. FXStreet does not in any way guarantee that this information is free from mistakes, errors, or material misstatements. It also does not guarantee that this information is of a timely nature. Investing in Open Markets involves a great deal of risk, including the loss of all or a portion of your investment, as well as emotional distress. All risks, losses and costs associated with investing, including total loss of principal, are your responsibility. The views and opinions expressed in this article are those of the authors and do not necessarily reflect the official policy or position of FXStreet nor its advertisers. The author will not be held responsible for information that is found at the end of links posted on this page.
If not otherwise explicitly mentioned in the body of the article, at the time of writing, the author has no position in any stock mentioned in this article and no business relationship with any company mentioned. The author has not received compensation for writing this article, other than from FXStreet.
FXStreet and the author do not provide personalized recommendations. The author makes no representations as to the accuracy, completeness, or suitability of this information. FXStreet and the author will not be liable for any errors, omissions or any losses, injuries or damages arising from this information and its display or use. Errors and omissions excepted.
The author and FXStreet are not registered investment advisors and nothing in this article is intended to be investment advice.
Recommended Content
Editors’ Picks

TON Foundation appoints new CEO after $400M investment: Will Toncoin price reach $5 in 2025?
The TON Foundation has named Maximilian Crown as its new Chief Executive Officer following a wave of strategic restructuring. Crown joins TON amid heightened focus on scaling blockchain adoption via Telegram’s vast user base.

SEC postpones decision on several crypto ETF filings after Paul Atkins assumes leadership
The SEC released several documents on Thursday stating that it is delaying its decision on crypto exchange-traded fund filings from Grayscale, Bitwise and Canary Capital as it seeks more time to conclude whether or not to approve the applications.

Ondo Finance hits $3B market cap as CEO Nathan Allman meets SEC to discuss tokenized US securities
Ondo Finance met with officials of the SEC and the law firm Davis Polk to discuss the regulation of tokenized US securities. Topics included registration requirements, broker-dealer rules and proposed compliant models for tokenized securities issuance.

Tron DAO announces $70B USDT supply: Here's how TRX price could react
TRON’s USDT circulation just surpassed $70 billion, signaling rising network utility as TRX price approaches a technically significant breakout. On Wednesday, TRON DAO confirmed that the circulating supply of Tether (USDT) on its blockchain has surpassed $70 billion.

Bitcoin Weekly Forecast: BTC holds steady, Fed warns of tariffs’ impact, as Gold hits new highs
Bitcoin price consolidates above $84,000 on Friday, a short-term support that has gained significance this week. The world's largest cryptocurrency by market capitalization continued to weather storms caused by US President Donald Trump's incessant trade war with China after pausing reciprocal tariffs for 90 days on April 9 for other countries.

The Best brokers to trade EUR/USD
SPONSORED Discover the top brokers for trading EUR/USD in 2025. Our list features brokers with competitive spreads, fast execution, and powerful platforms. Whether you're a beginner or an expert, find the right partner to navigate the dynamic Forex market.