![]() Tanya Abrosimova
Tanya Abrosimova
Independent Analyst
- NEO mainnet update will be launched on block 6,200,000.
- NEO/USD is trading within a short-term sliding channel.
- A sustainable move above $25.50 will signal that the downside correction is over.
NEO is the 16th largest digital asset with the current market capitalization of $1.77 billion and an average daily trading volume of $1.2 billion, mostly in line with the current values. NEO/USD topped at $25.89 and retreated to the recent low of $22.76 on Sunday, September 20. At the time of writing, the coin is changing hands at $24.89. Despite the recovery, it is still down over 4% on a day-to-day basis.
NEO gets ready for mainnet update
NEO developers announced a significant mainnet update that would drastically change the transaction prioritization mechanism and alter the free gas threshold. A bidding mode introduced in the new version will give the priority for processing transactions with higher GAS.
The new version was 2.12.0, will be activated on block 6,200,000. According to the press release published on the project's official blog, the developers expected to launch the update on September 20; however, we are still eight blocks away from the target value.
NEO on-chain statistics
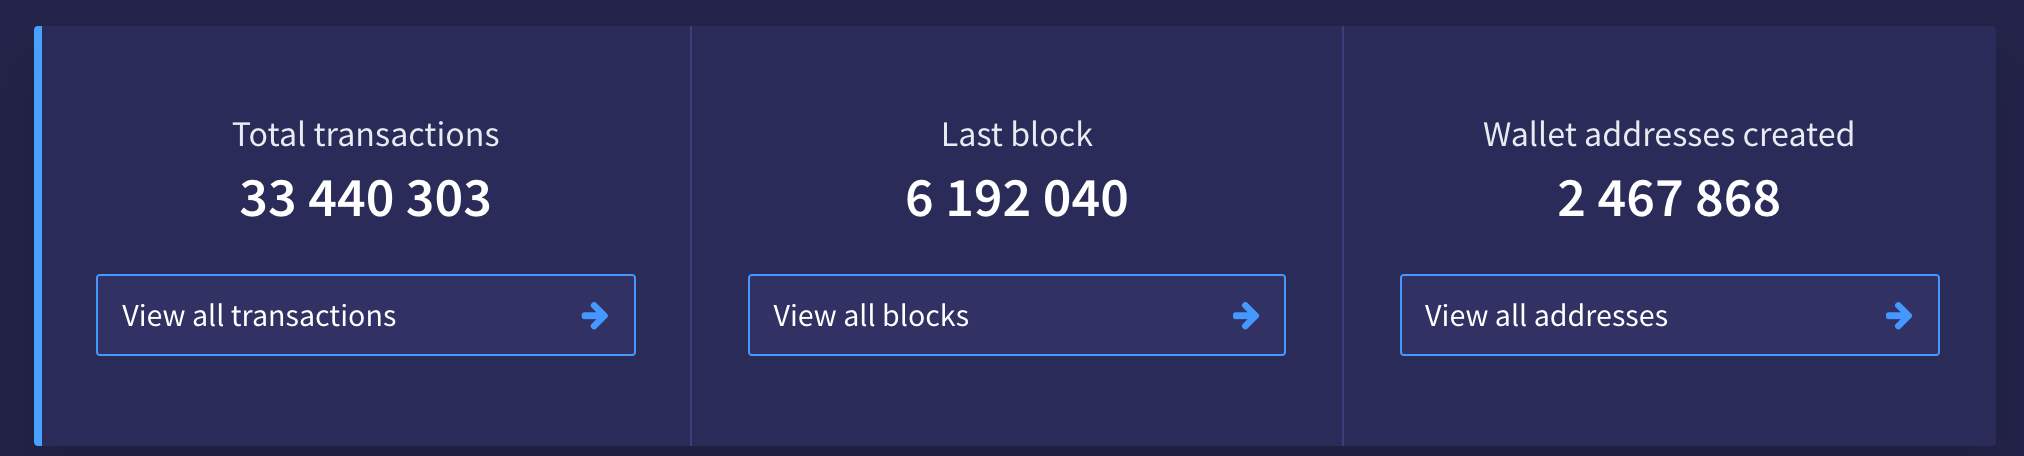
Source: neoscan.io
The MainNet might be temporarily unstable during the activation period, meaning that NEO may be in for short-term price turbulence.
The hard fork will occur at block height 620000; we urge all relevant parties to pay attention and perform the upgrade in advance in order to avoid data conflicts.
NEO/USD: The technical picture
On the 4-hour chart, NEO/USD is moving within a downside-looking channel with the support currently at $23.00. As we have reported earlier, this area served as a local resistance for the coin before it was turned into support during the previous week.
If the upside momentum is sustained, the price may recovery to the channel resistance at $25.50, closely followed by the recent recovery high of $25.89. Once this area is cleared, the bullish momentum may start gaining traction with the next focus on $27.00, signaling that the downside correction is over.
Meanwhile, the support of $23.00 is reinforced by the 4-hour SMA50 at $22.50. A sustainable move below this area will invalidate the short-term bullish scenario and bring $20.00 into view.
NEO/USD 4-hour chart

If we zoom out a 12-hour chart, the support of $20.00 is reinforced by SMA50, meaning that the bears will have a hard time pushing the price below this area. This psychological line has been limiting the downside correction since September 13, while all sell-off attempts were heavily bought. A daily close below this area will attract new bears to the market and increase the selling pressure with the next target of $19.00 (the lower line of the 12-hour Bollinger Band) and $17.60 (12-hour SMA100).
NEO/USD 12-hour hour

To conclude: NEO/USD has recovered from the short-term channel support is moving within the short-term sliding channel. A sustainable move above $25.50 will signal that the correction is over and bring the upside trend back on track. On the other hand, the critical support is created by $20.00, a sustainable move lower will negate the favorable scenario at this stage.
Note: All information on this page is subject to change. The use of this website constitutes acceptance of our user agreement. Please read our privacy policy and legal disclaimer. Opinions expressed at FXstreet.com are those of the individual authors and do not necessarily represent the opinion of FXstreet.com or its management. Risk Disclosure: Trading foreign exchange on margin carries a high level of risk, and may not be suitable for all investors. The high degree of leverage can work against you as well as for you. Before deciding to invest in foreign exchange you should carefully consider your investment objectives, level of experience, and risk appetite. The possibility exists that you could sustain a loss of some or all of your initial investment and therefore you should not invest money that you cannot afford to lose. You should be aware of all the risks associated with foreign exchange trading, and seek advice from an independent financial advisor if you have any doubts.
Recommended Content
Editors’ Picks

Bitcoin holds $84,000 despite Fed’s hawkish remarks and spot ETFs outflows
Bitcoin is stabilizing around $84,000 at the time of writing on Thursday after facing multiple rejections around the 200-day EMA at $85,000 since Saturday. Despite risk-off sentiment due to the hawkish remarks by the US Fed on Wednesday, BTC remains relatively stable.

Crypto market cap fell more than 18% in Q1, wiping out $633.5 billion after Trump’s inauguration top
CoinGecko’s Q1 Crypto Industry Report highlights that the total crypto market capitalization fell by 18.6% in the first quarter, wiping out $633.5 billion after topping on January 18, just a couple of days ahead of US President Donald Trump’s inauguration.

Top meme coin gainers FARTCOIN, AIDOGE, and MEW as Trump coins litmus test US SEC ethics
Cryptocurrencies have been moving in lockstep since Monday, largely reflecting sentiment across global markets as United States (US) President Donald Trump's tariffs and trade wars take on new shapes and forms each passing day.

XRP buoyant above $2 as court grants Ripple breathing space in SEC lawsuit
A US appellate court temporarily paused the SEC-Ripple case for 60 days, holding the appeal in abeyance. The SEC is expected to file a status report by June 15, signaling a potential end to the four-year legal battle.
Bitcoin Weekly Forecast: Market uncertainty lingers, Trump’s 90-day tariff pause sparks modest recovery
Bitcoin (BTC) price extends recovery to around $82,500 on Friday after dumping to a new year-to-date low of $74,508 to start the week. Market uncertainty remains high, leading to a massive shakeout, with total liquidations hitting $2.18 billion across crypto markets.

The Best brokers to trade EUR/USD
SPONSORED Discover the top brokers for trading EUR/USD in 2025. Our list features brokers with competitive spreads, fast execution, and powerful platforms. Whether you're a beginner or an expert, find the right partner to navigate the dynamic Forex market.