NEO Elliott Wave technical analysis [Video]
![NEO Elliott Wave technical analysis [Video]](https://editorial.fxstreet.com/images/Markets/Currencies/Cryptocurrencies/Coins/NEO/neo_XtraLarge.jpg)
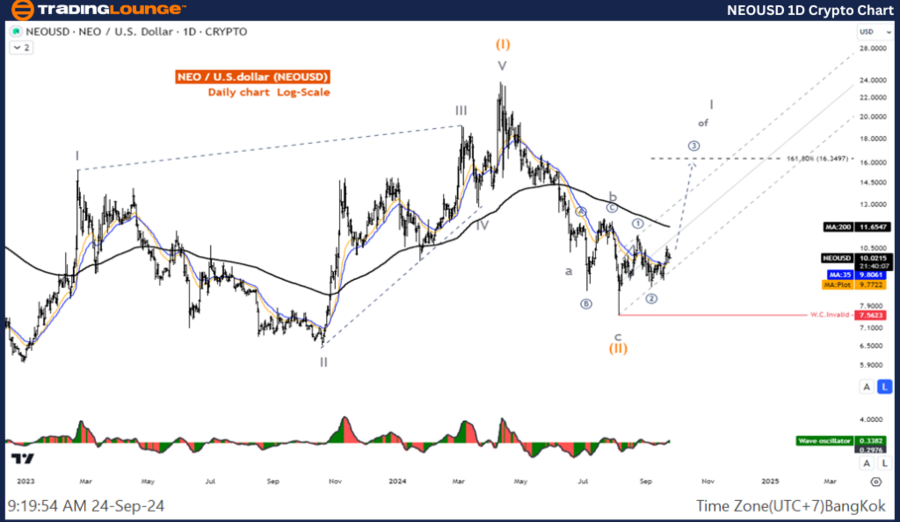
Elliott Wave Analysis TradingLounge daily chart.
NEO.USD Elliott Wave technical analysis
Function: Counter Trend
Mode: Corrective
Structure: Zigzag
Position: Wave C
Direction next higher degrees: Wave (II) of Impulse
Wave cancel invalid level: 9.85
Details: Wave (II) is likely to have ended and prices are resuming the uptrend.
NEO/ U.S. dollar (NEOUSD) Trading Strategy: It looks like the wave (II) correction is complete and the price is still likely to move up. Look for an opportunity to join the wave (III) uptrend.
NEO/ U.S. dollar (NEOUSD)Technical Indicators: The price is above the MA200 indicating an uptrend, The Wave Oscillator is a Bearish Momentum.
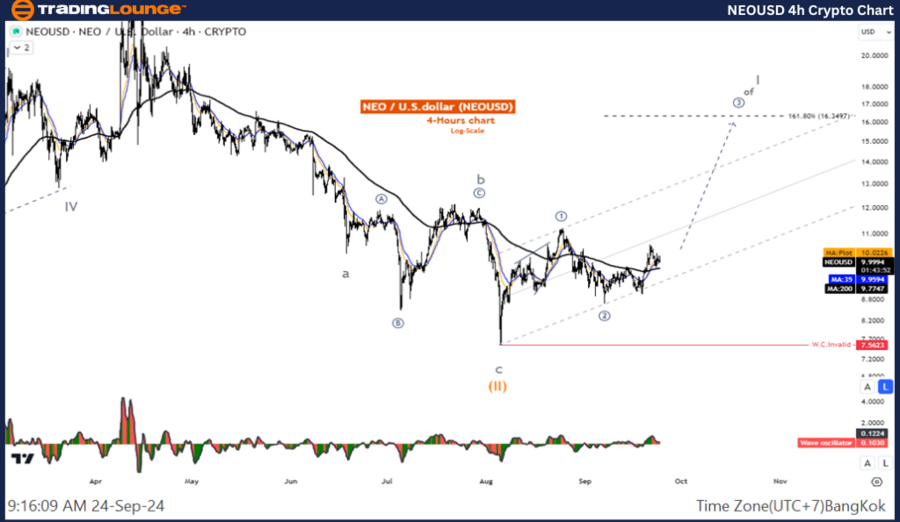
Elliott Wave Analysis TradingLounge H4 Chart.
NEO/USD Elliott Wave technical analysis
Function: Counter Trend.
Mode: Corrective.
Structure: Zigzag.
Position: Wave C.
Direction Next higher Degrees: Wave (2) of Impulse.
Wave Cancel invalid Level: 9.85.
Details: Wave (II) is likely to have ended and prices are resuming the uptrend.
NEO/ U.S. dollar (NEOUSD) Trading Strategy: It looks like the wave (2) correction is complete and the price is still likely to move up. Look for an opportunity to join the wave (3) uptrend.
NEO/ U.S. dollar (NEOUSD) Technical Indicators: The price is above the MA200 indicating an uptrend, The Wave Oscillator is a Bearish Momentum.
NEO Elliott Wave technical analysis [Video]
Author

Peter Mathers
TradingLounge
Peter Mathers started actively trading in 1982. He began his career at Hoei and Shoin, a Japanese futures trading company.


