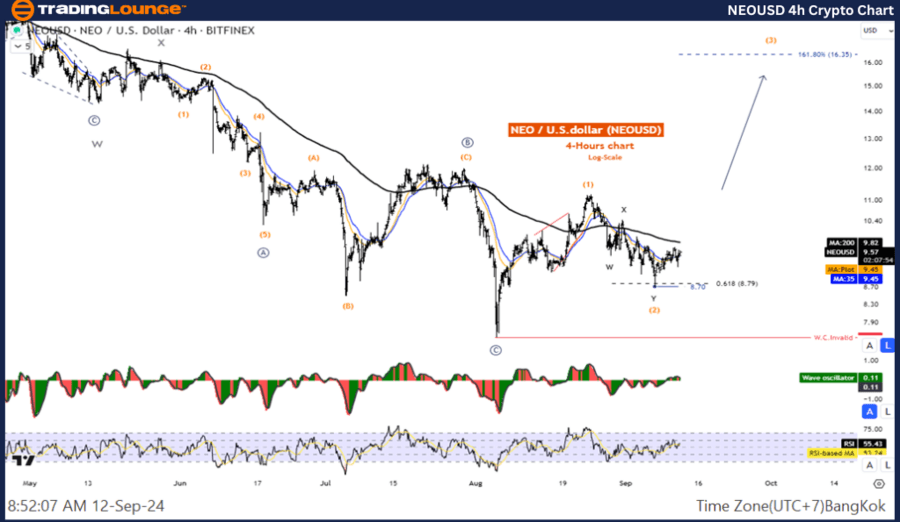
NEO/USD Elliott Wave technical analysis

Function: Counter Trend.

Mode: Corrective.

Structure: Double Corrective.

Position: Wave Y.

Direction next higher degrees: Wave (II) of Impulse.

Wave cancel invalid level: 9.85.

Details: Wave (II) is likely to have ended and prices are resuming the uptrend.

NEO /U.S. dollar (NEOUSD) Trading Strategy: It looks like the wave (II) correction is complete and the price is still likely to move up. Look for an opportunity to join the wave (III) uptrend.

NEO /U.S. dollar (NEOUSD)Technical Indicators: The price is below the MA200 indicating a downtrend, The Wave Oscillator is a Bearish Momentum.

NEO

NEO/USD Elliott Wave technical analysis

Function: Counter Trend.

Mode: Corrective.

Structure: Double Corrective.

Position: Wave Y.

Direction next higher degrees: Wave (II) of Impulse.

Wave cancel invalid lLevel: 9.85.

Details: Wave (II) is likely to have ended and prices are resuming the uptrend.

NEO / U.S. dollar (NEOUSD)Trading Strategy: It looks like the wave 2 correction is complete and the price is still likely to move up. Look for an opportunity to join the wave 3 uptrend.

NEO / U.S. dollar (NEOUSD)Technical Indicators: The price is below the MA200 indicating a downtrend, The Wave Oscillator is a Bearish Momentum.

NEO

NEO Elliott Wave technical analysis [Video]


As with any investment opportunity there is a risk of making losses on investments that Trading Lounge expresses opinions on.

Historical results are no guarantee of future returns. Some investments are inherently riskier than others. At worst, you could lose your entire investment. TradingLounge™ uses a range of technical analysis tools, software and basic fundamental analysis as well as economic forecasts aimed at minimizing the potential for loss.

The advice we provide through our TradingLounge™ websites and our TradingLounge™ Membership has been prepared without considering your objectives, financial situation or needs. Reliance on such advice, information or data is at your own risk. The decision to trade and the method of trading is for you alone to decide. This information is of a general nature only, so you should, before acting upon any of the information or advice provided by us, consider the appropriateness of the advice considering your own objectives, financial situation or needs. Therefore, you should consult your financial advisor or accountant to determine whether trading in securities and derivatives products is appropriate for you considering your financial circumstances.

Recommended content


Recommended Content

Editors’ Picks

Uniswap price is poised for a rally if it breaks above the ascending triangle pattern

Uniswap price is poised for a rally if it breaks above the ascending triangle pattern

Uniswap trades inside an ascending triangle pattern; a breakout signals a rally ahead. This bullish move is further supported by UNI’s on-chain data, which shows a negative Exchange Flow Balance and decreasing exchange supply.

More Uniswap News
Ethereum ETF and exchange investors step up buying pressure following spike in key metrics

Ethereum ETF and exchange investors step up buying pressure following spike in key metrics

Ethereum (ETH) was down 1% on Wednesday as investors stepped up their buying pressure via exchange-traded funds (ETF) and exchanges. This could be due to ETH's potential to rally after the end of its historical Q3 market lull.

More Ethereum News
Render could rally if it sustains an extended move above key resistance

Render could rally if it sustains an extended move above key resistance

Render is down 2% on Wednesday as it attempts to break above the $5.155 key resistance level. This move could trigger a rally and cause a notable uptick in average gains for investors who purchased it within the last 30 days.

More Render News
Bitcoin sustains $57K despite August CPI report

Bitcoin sustains $57K despite August CPI report

The crypto market saw slight declines after the US monthly inflation data came in at a 0.2% increase on Wednesday. The steady prices suggest that investors are not panicking at the possibility of a 25 basis point (bps) rate cut as opposed to earlier anticipation of a 50 bps cut.

More Bitcoin News
Bitcoin: $50,000 on the horizon if it breaks below key support level

Bitcoin: $50,000 on the horizon if it breaks below key support level

Bitcoin (BTC) price tests the key support level at $56,000 on Friday, consolidating over a 1% decline this week. If it drops below this support, a continued downtrend is likely for BTC, as suggested by substantial outflows from US spot Bitcoin ETFs, rising institutional selling, and bearish on-chain indicators.

Read full analysis
Moneta Markets review 2024: All you need to know

Moneta Markets review 2024: All you need to know

VERIFIED In this review, the FXStreet team provides an independent and thorough analysis based on direct testing and real experiences with Moneta Markets – an excellent broker for novice to intermediate forex traders who want to broaden their knowledge base.

Read More

BTC

ETH

XRP