Money begins to flow outside Bitcoin to DeFI with SNX, YFI, and CRV prices exploding
- Despite Bitcoin's current strength, some DeFi projects like SNX, YFI and CRV are raking some gains.
- The entire market capitalization jumped by $27 billion in the past 24 hours.
There is still no clear winner of the 2020 US presidential elections but it seems that the crypto market simply doesn't care. Although Bitcoin continues leading the way at $14,900, several altcoins, especially DeFi coins, also see significant gains.
Synthetic Network Token has been up by 16% in the past 24 hours but remains in a strong downtrend. Similarly, YFI is rebounding, currently at $9,299, although far away yet from its peak of $39,875 on September 14. Curve continues trading sideways but this recent 8% price spike could shift the odds in favor of the bulls.
 [16.35.54, 05 Nov, 2020]-637401879766121958.png)
Bitcoin Exchange Outflow chart
On November 2 and 3, the Exchange Outflow chart provided by the behavioral analytics platform Santiment showed several massive spikes, which indicates a lot of investors were withdrawing their Bitcoins from exchanges to either hold or exchange them for other altcoins. Out of the top 100 DeFi coins, 83 are in positive in the past 24 hours.
Can SNX finally change the current downtrend?
SNX is trading at $2.93 after a massive price spike from the low at $2.54 just 12 hours ago. The digital asset has faced two positive days in a row with increasing bull volume as the Relative Strenght Index (RSI) hit oversold on the daily chart.
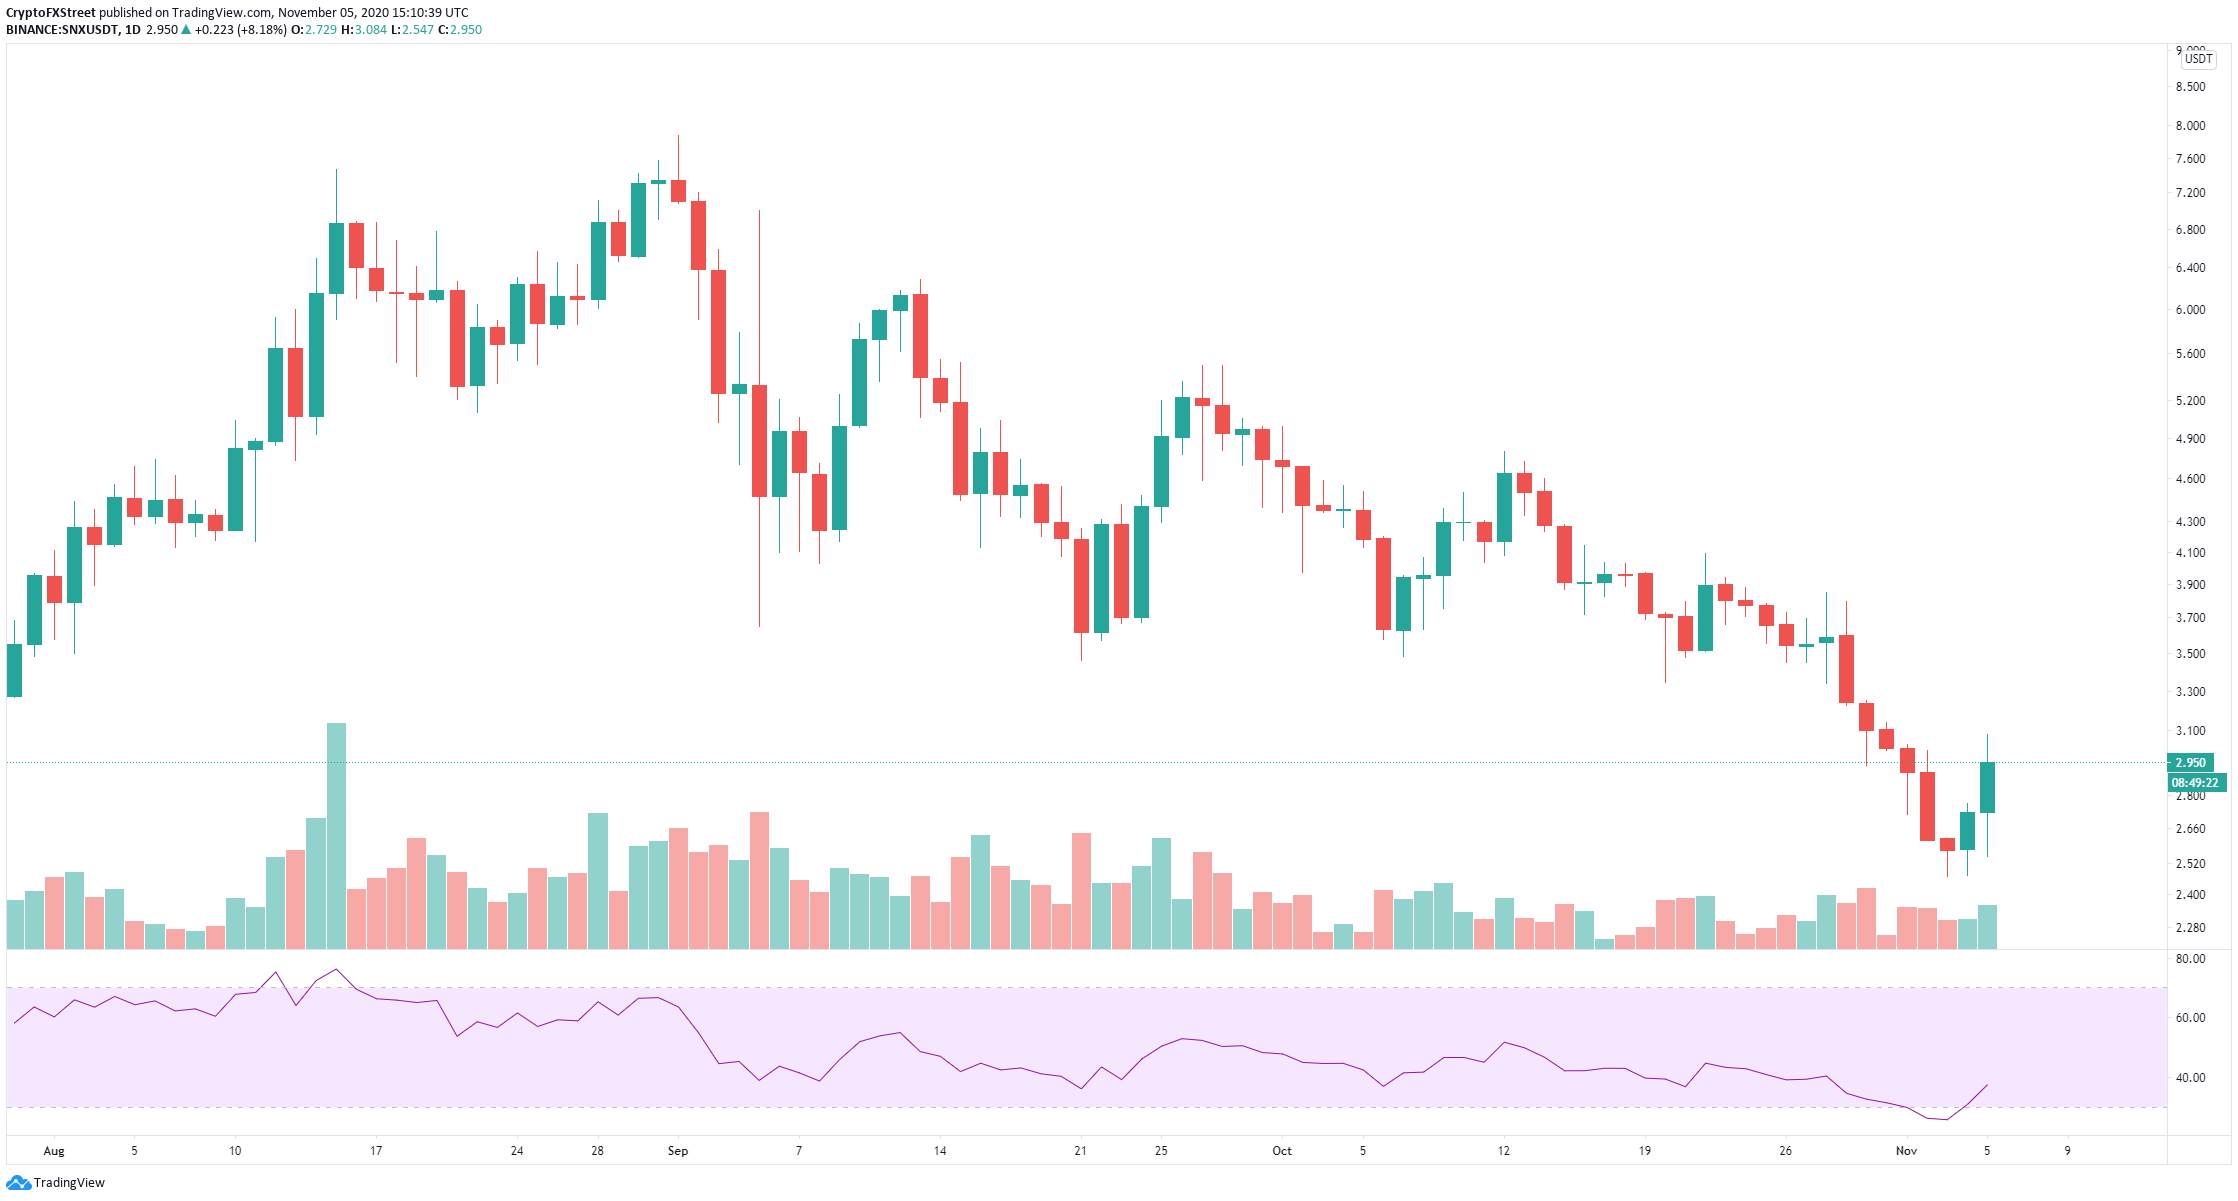
SNX/USD daily chart
The In/Out of the Money Around Price (IOMAP) chart shows a robust resistance area between $2.91 and $2.99, where 2.78 million SNX tokens were bought, creating a lot of selling pressure. A breakout above this point can quickly drive the price of SNX towards $3.34, as there seems to be very little opposition above.
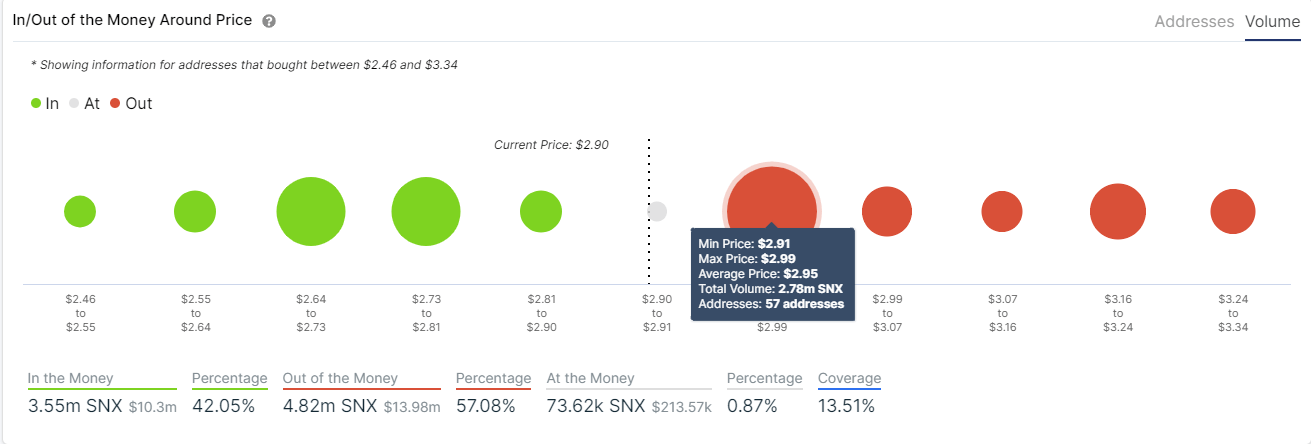
SNX IOMAP chart
On the other hand, looking at the 4-hour chart, the 50-SMA can be seen at $2.95, acting as a robust resistance level. Rejection from this level can push SNX towards $2.73, a significant support level, according to the IOMAP chart.
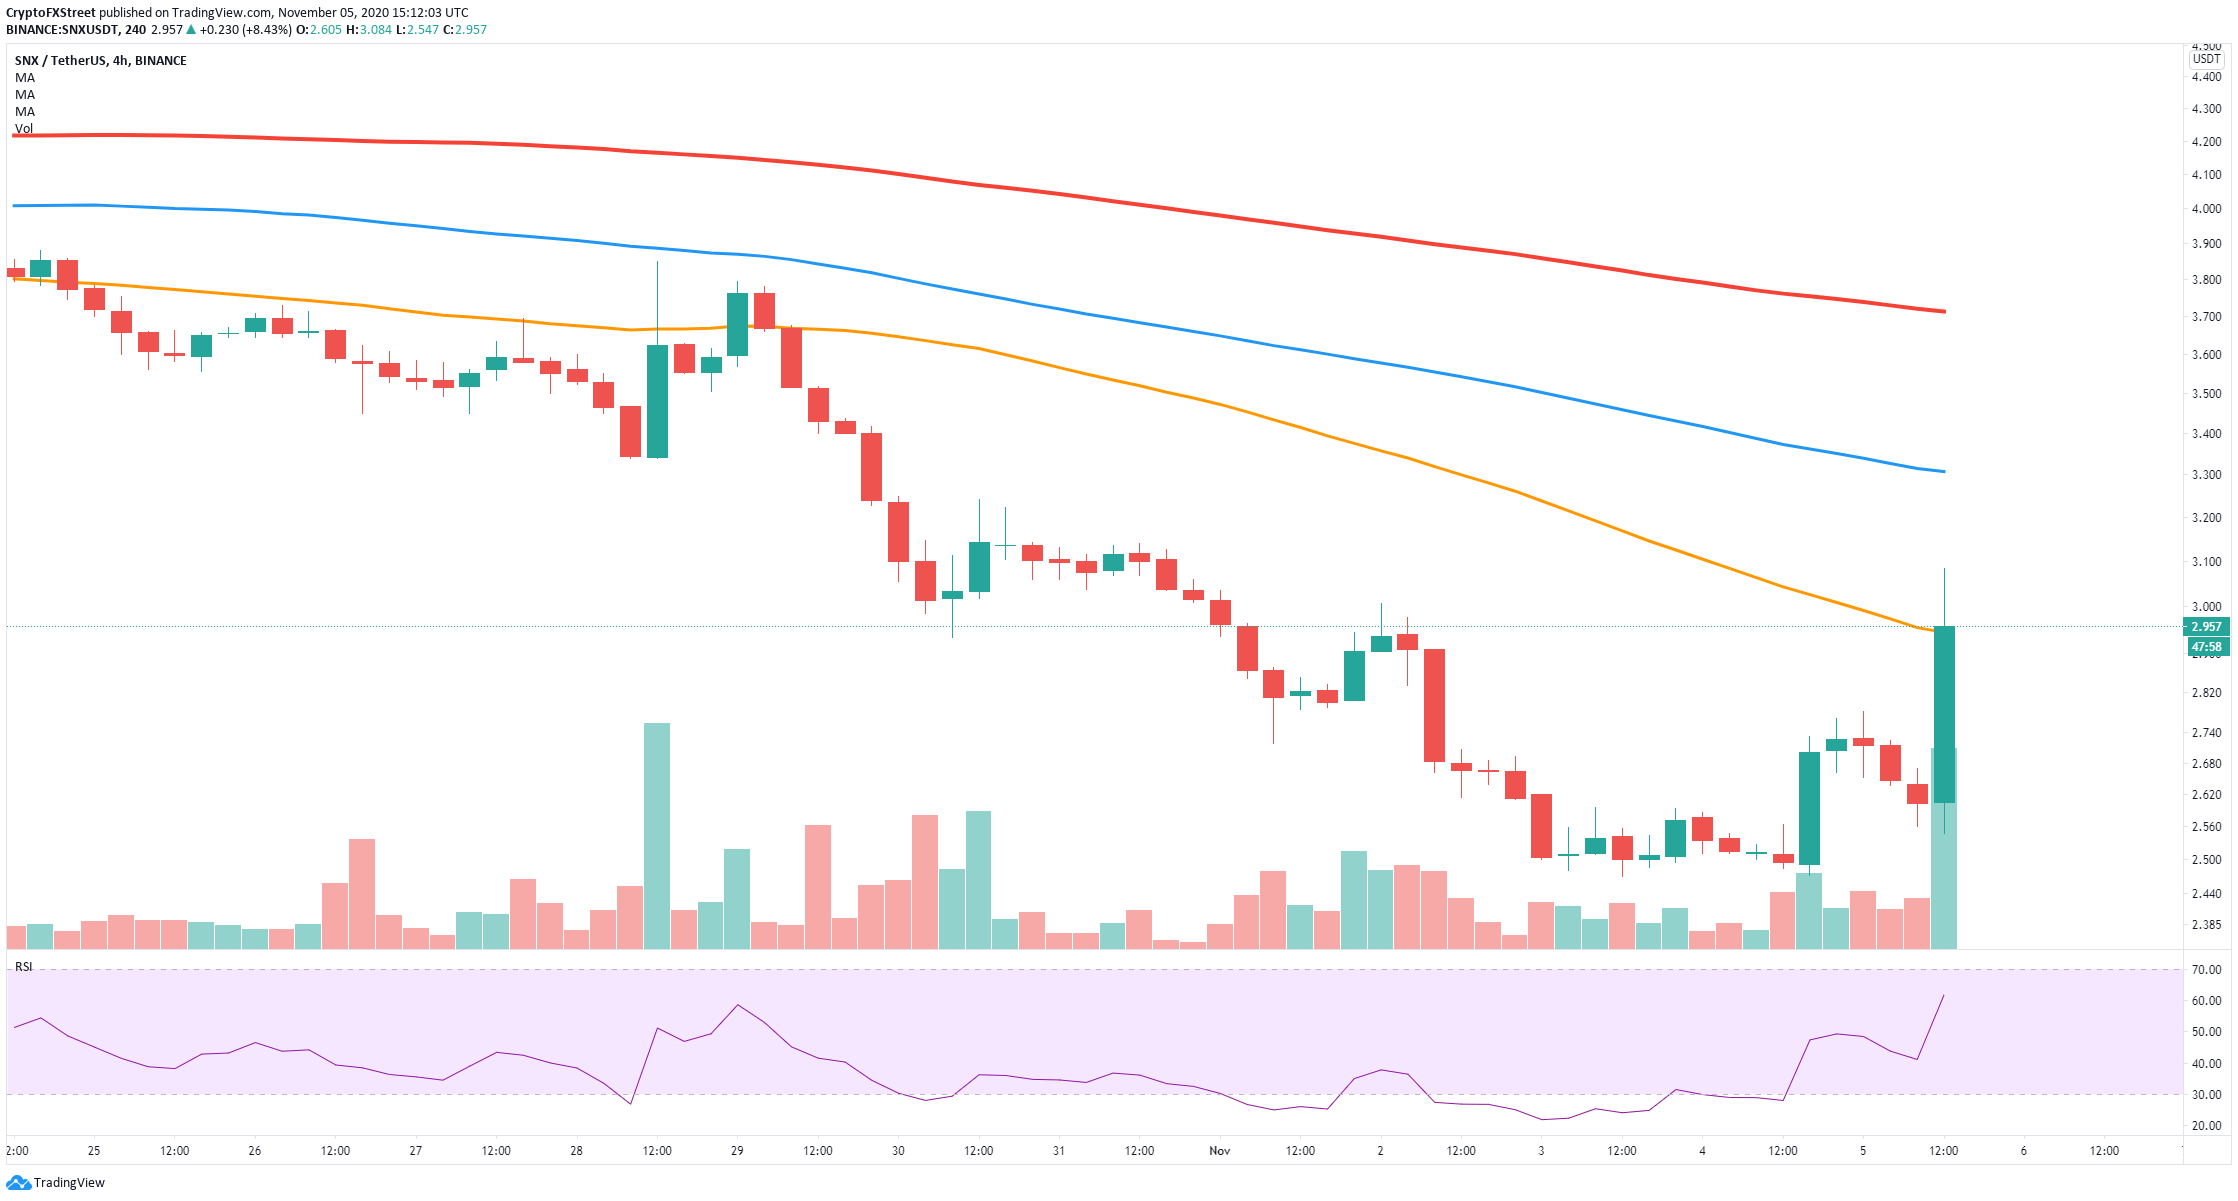
SNX/USD 4-hour chart
YFI struggles to rebound despite overall market strength
YFI is down by 78% since its all-time high at $43,966 and has tried to rebound several times in the last two months with no success. In the past 24 hours, the digital asset is up by 30% from a low of $7,451 to a current price of $9,785.
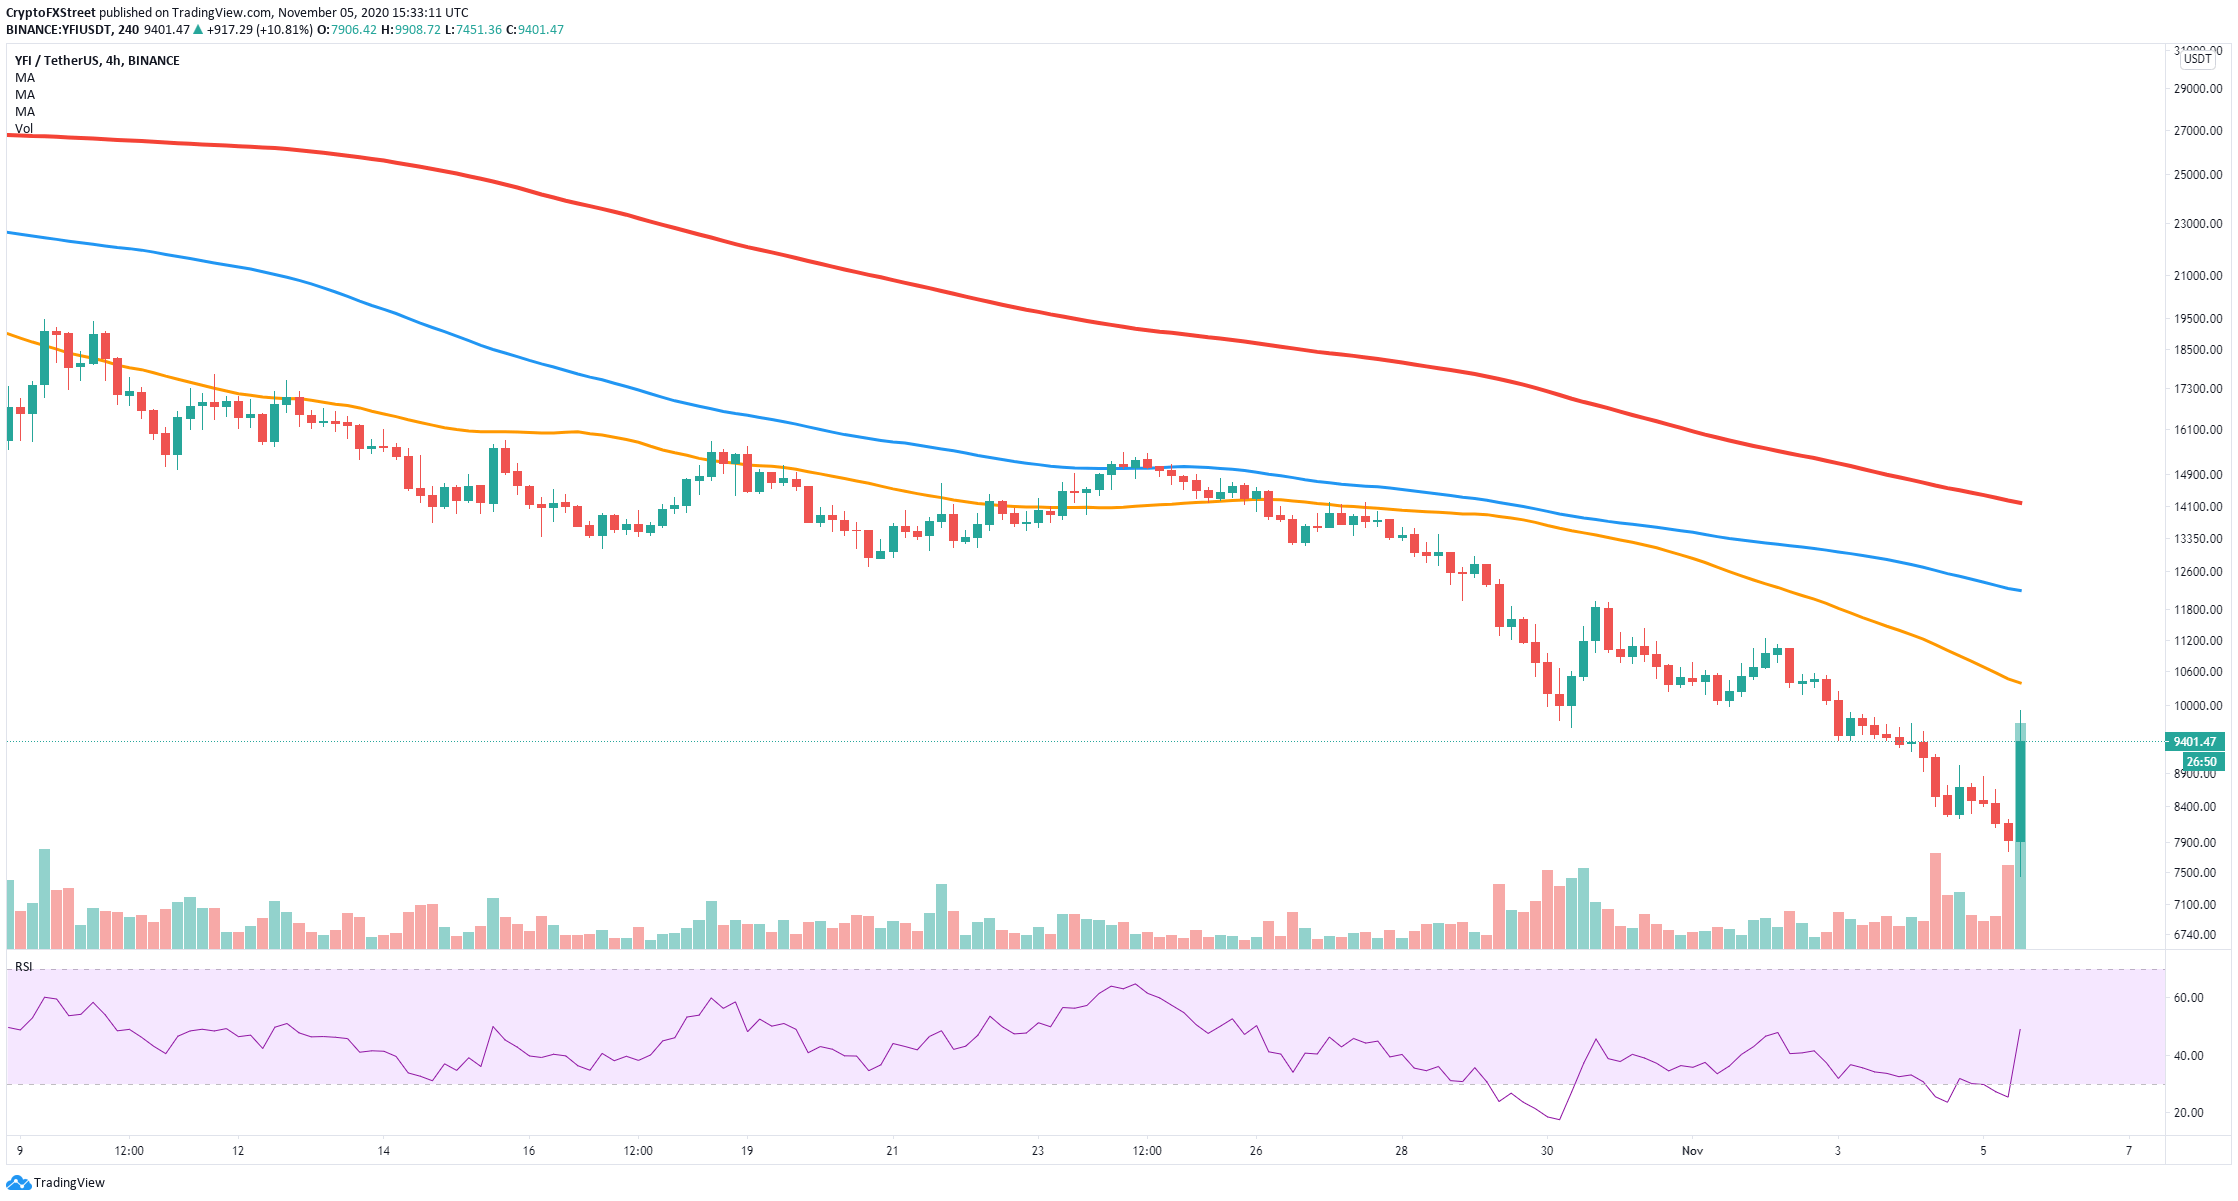
YFI/USD 4-hour chart
One of the most notable bullish factors of this price spike is the colossal trading volume in the last 4 hours, which is the highest one ever recorded. The 50-SMA on the 4-hour chart will act as a resistance level and as the next price target at $10,395, followed by $12,200, the 100-SMA.
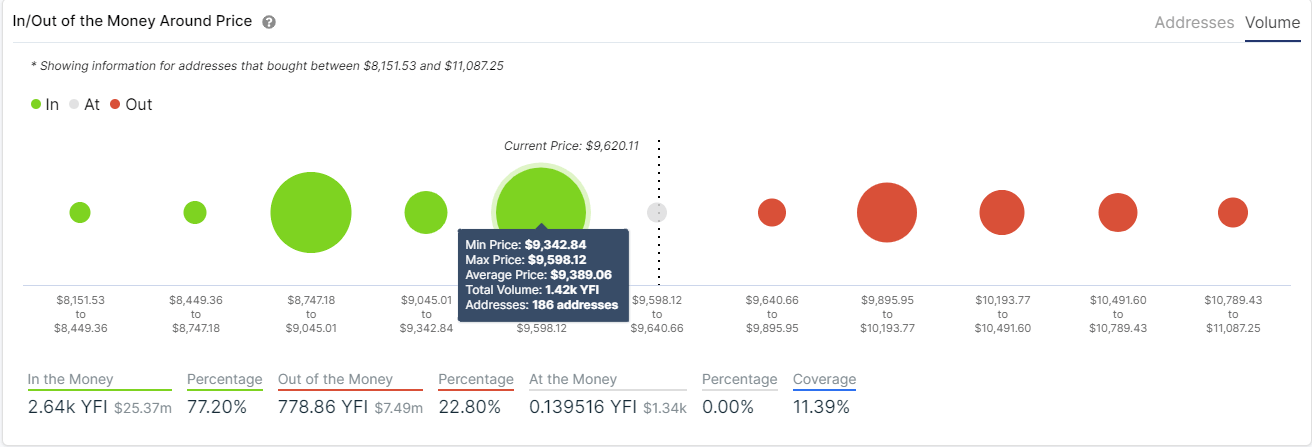
YFI IOMAP chart
Aditionally, rejection from the resistance level at $10,395 on the 4-hour chart can push YFI towards $9,342, as it is the next most significant support level according to the IOMAP chart, followed by the range between $8,747 and $9,045.
Curve sees a 10% price jump but remains in a downtrend
Despite the current spike of 10%, taking CRV to $0.375, the price of the digital asset is still bounded inside an extended daily downtrend. On October 27, CRV exploded by 70% just to lose all gains a week later.
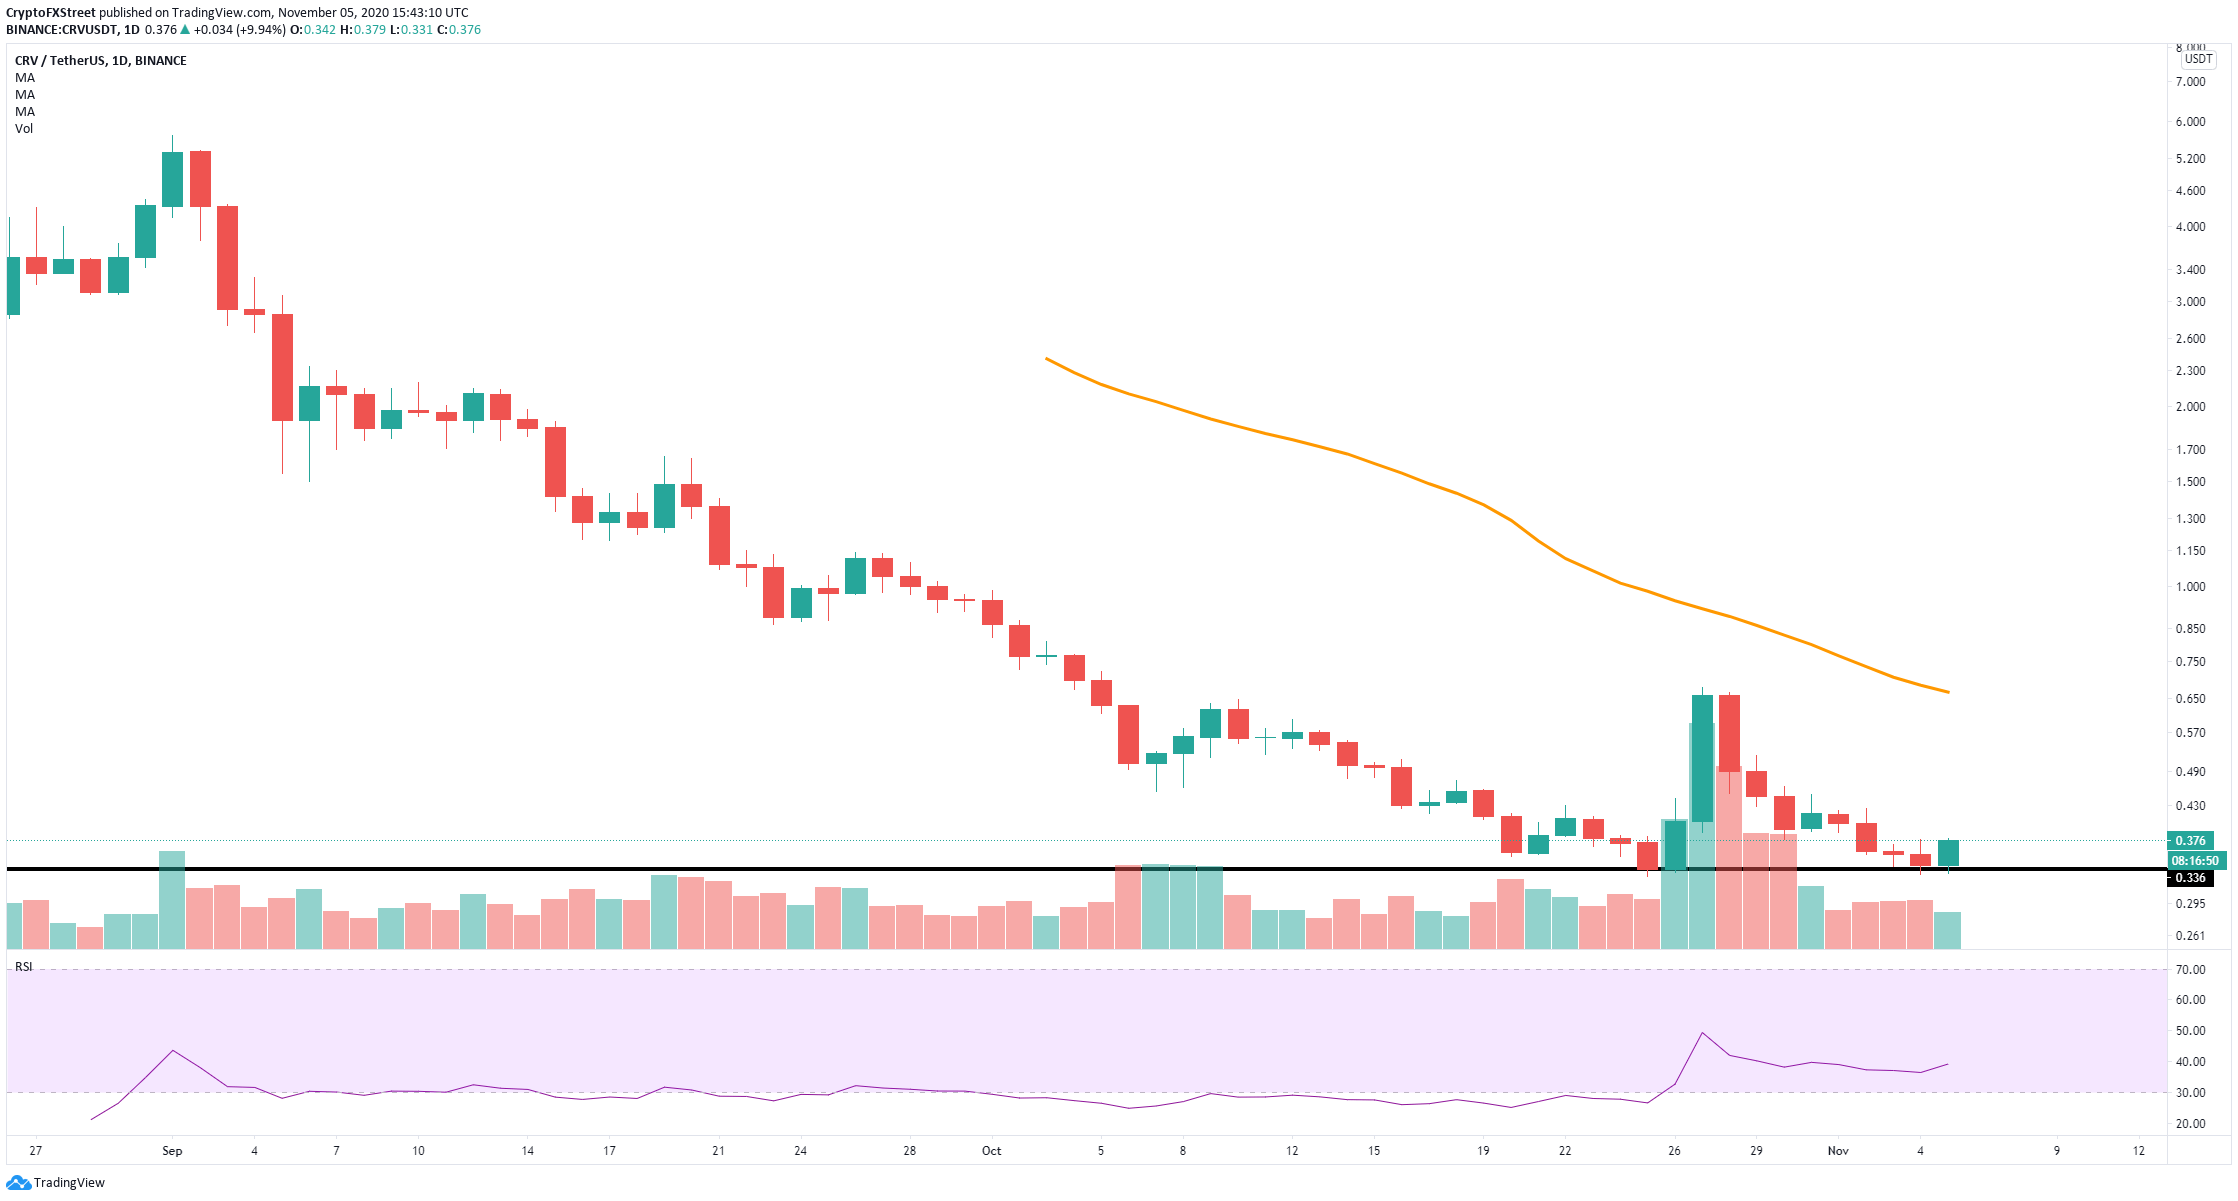
CRV/USD daily chart
The current candlestick is notably smaller than the one seen on October 27 and doesn't change the daily downtrend. The most significant support level is established at $0.336. A breakdown from this point can drive the Curve price towards $0.3.
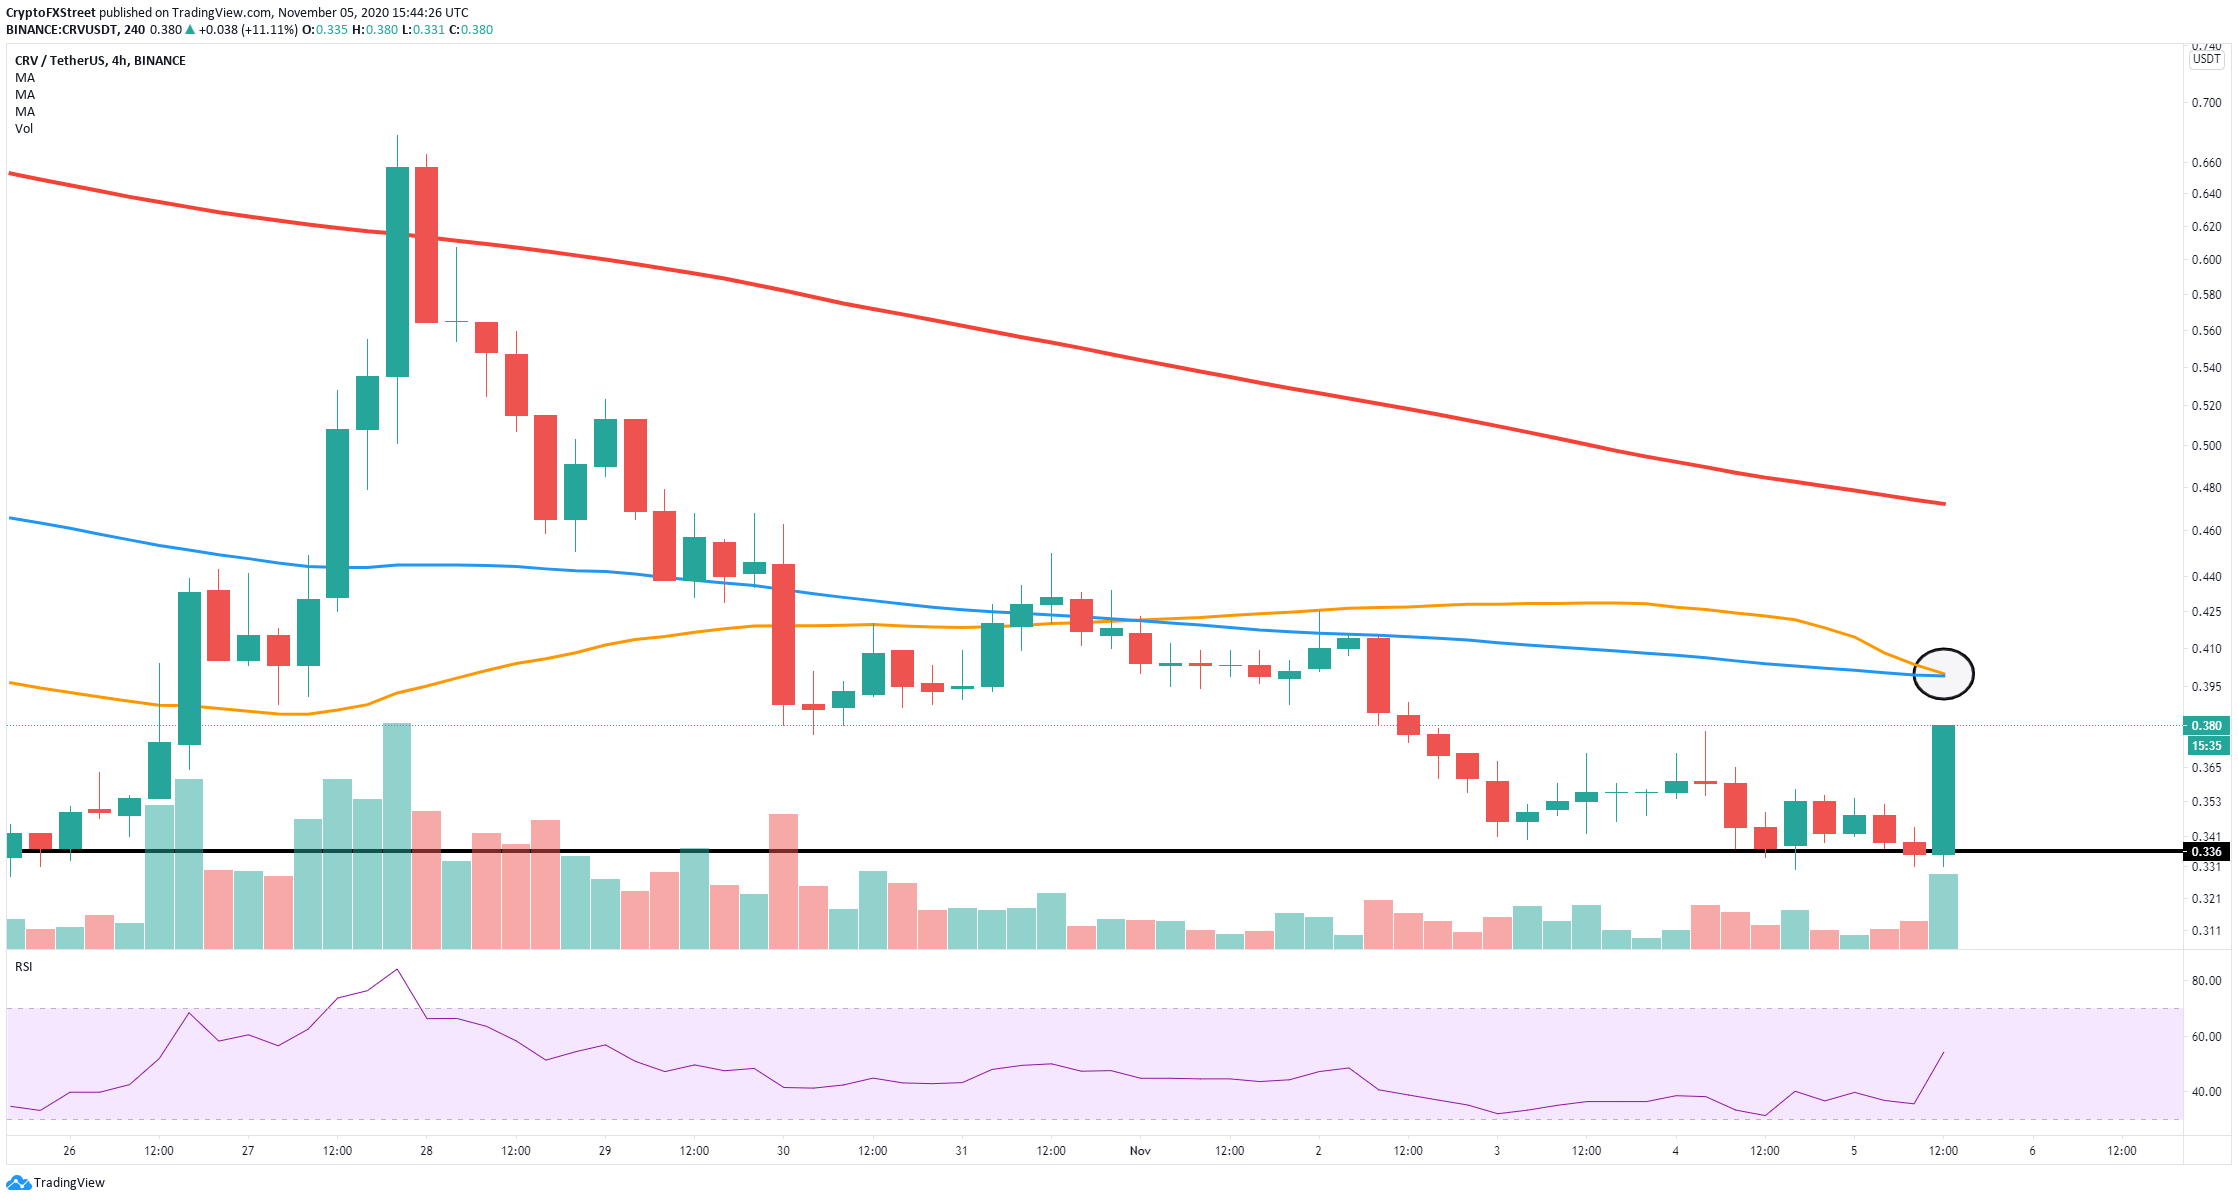
CRV/USD 4-hour chart
The 4-hour chart shows a precise resistance level at $0.4, which coincides with both the 50-SMA and the 100-SMA. A breakout above this critical point can drive the price of CRV to $0.47, where the 200-SMA is located.
Author

Lorenzo Stroe
Independent Analyst
Lorenzo is an experienced Technical Analyst and Content Writer who has been working in the cryptocurrency industry since 2012. He also has a passion for trading.


