![]() Rajarshi Mitra
Rajarshi Mitra
Independent Analyst
- The bulls must overcome resistance at the SMA 20 curve to continue upward momentum.
- The Elliott Oscillator had a bearish session following nine straight bullish sessions.
XMR/USD is on course of charting a second bullish day in a row. So far this Friday, the price of XMR/USD has gone up from $53.50 to $53.75. Looking at the hourly Monero chart, we can see that the price fell till $51.85, where it found intraday support and bounced up to $54.48. That was where the bulls ran out of steam and then corrected itself around $53.75. The 20-day Bollinger band has constricted, which indicates low market volatility.
XMR/USD daily chart
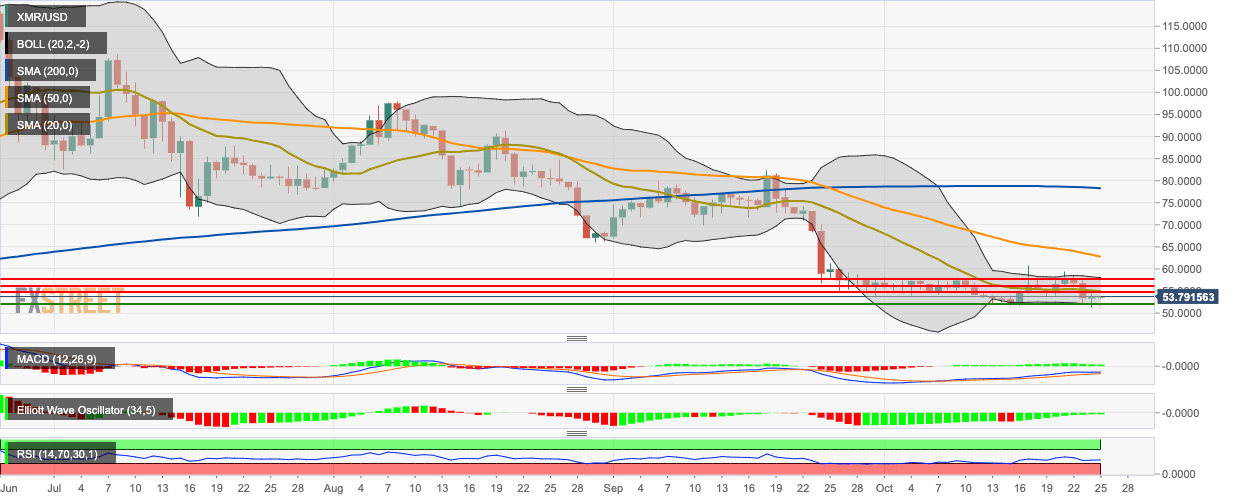
The 20-day Simple Moving Average (SMA 20) curve acts as immediate market resistance. The Moving Average Convergence/Divergence (MACD) indicator shows decreasing bullish momentum, while the Elliott Oscillator has had a bearish session following nine straight bullish sessions. The Relative Strength Index (RSI) indicator is trending around 40.
Note: All information on this page is subject to change. The use of this website constitutes acceptance of our user agreement. Please read our privacy policy and legal disclaimer. Opinions expressed at FXstreet.com are those of the individual authors and do not necessarily represent the opinion of FXstreet.com or its management. Risk Disclosure: Trading foreign exchange on margin carries a high level of risk, and may not be suitable for all investors. The high degree of leverage can work against you as well as for you. Before deciding to invest in foreign exchange you should carefully consider your investment objectives, level of experience, and risk appetite. The possibility exists that you could sustain a loss of some or all of your initial investment and therefore you should not invest money that you cannot afford to lose. You should be aware of all the risks associated with foreign exchange trading, and seek advice from an independent financial advisor if you have any doubts.
Recommended Content
Editors’ Picks
Zilliqa price poised for a rally on positive on-chain data; bullish technical indicators

Zilliqa price has broken above a falling wedge pattern, indicating a shift in market structure from bearish to bullish. Bullish divergence on the RSI and the Awesome Oscillator indicators signal a potential reversal and upward movement in ZIL price in the coming days.
MATIC sets for a rally as Polygon Foundation confirms the migration date

Polygon (MATIC) price has broken above a falling wedge pattern, indicating a shift in market structure from bearish to bullish. The Polygon Foundation officially announced on Thursday that September 4 is the migration date for MATIC to POL.
Top 10 crypto market movers as Bitcoin and Ethereum hold steady ahead of $1.8 billion options expiry

Bitcoin and Ethereum hold steady above $64,000 and $3,400 as $1.8 billion in options expire on Friday. WazirX hack of $230 million potentially linked to Lazarus Group ushers correction in Shiba Inu, among other assets.
Bitcoin Weekly Forecast: Will BTC continue its bullish momentum?

Bitcoin price increased by 5.5% this week until Friday after breaking above a descending trendline. Currently, it is trading slightly higher by 0.23% at $64,166. By Thursday of this week, U.S. spot Bitcoin ETFs observed cumulative positive inflows totaling $861.50 million.
Bitcoin: Will BTC continue its bullish momentum?
Bitcoin (BTC) price increased by 5.5% this week until Friday after breaking above a descending trendline. Currently, it is trading slightly higher by 0.23% at $64,166. By Thursday of this week, U.S. spot Bitcoin ETFs observed cumulative positive inflows totaling $861.50 million. On-chain data indicates oversold conditions for BTC, suggesting a possible market bottom.