• MATIC price shows no directional bias as it hovers above the trading range’s midpoint at $1.8.
  • Investors can expect Polygon to make a 25% move in either direction and face significant barriers.
  • The RSI skews odds in favor of bulls, suggesting a retest of $2.06.

MATIC price has been sloping lower since October 29 and is fast approaching the trading range’s midpoint. A rebound from this downswing is likely to trigger Polygon to climb higher.

MATIC price at make or break point

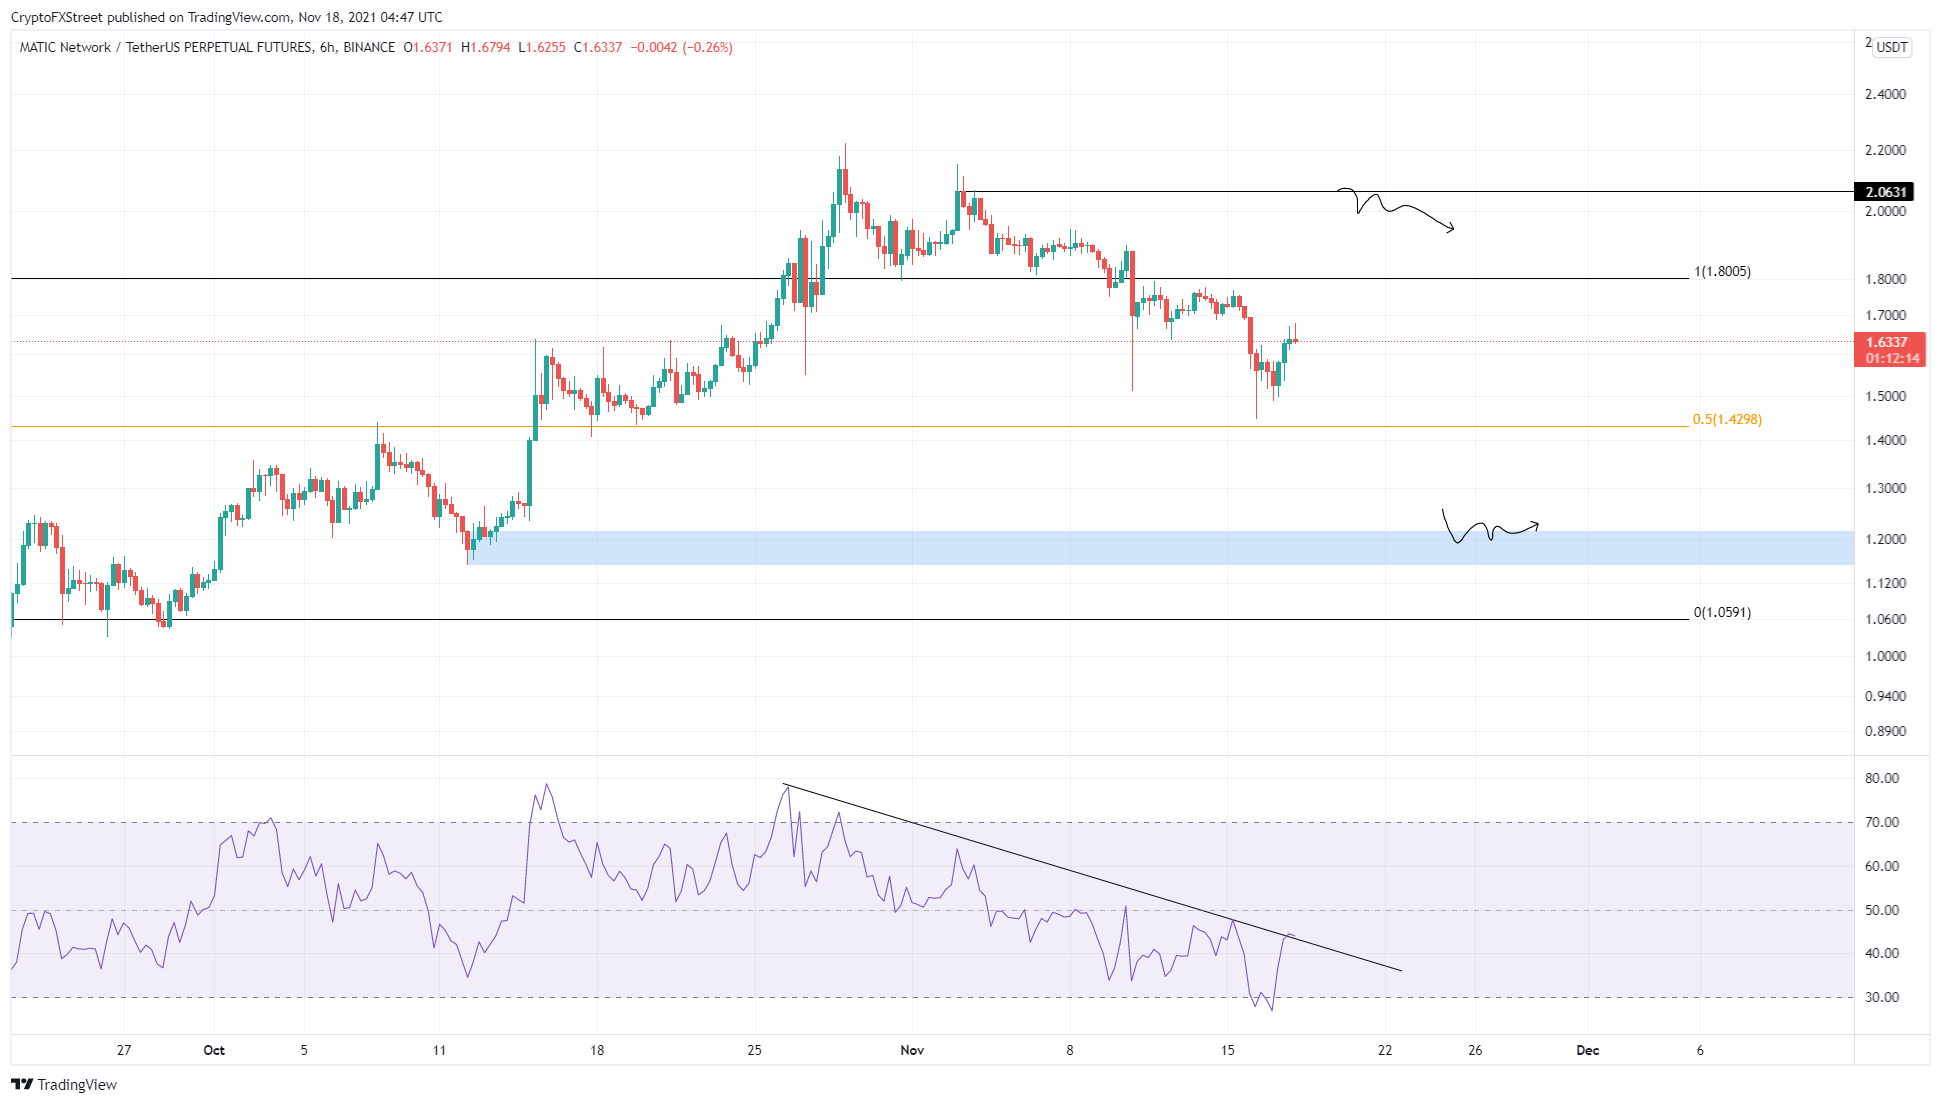
MATIC price has crashed roughly 21% from October 29 to where it currently trades, at $1.63. This downswing has reentered the $1.05 to $1.80 trading range. The pullback that originated on October 29 pushed Polygon close to retest the midpoint at $1.42 but failed to do so.

The premature upswing has propelled MATIC price by 16% and looks ready for a minor down move before it embarks on an upswing.

The Relative Strength Index (RSI) is the main reason for this bullish bias. This indicator has produced roughly six lower highs, which can be connected using a trend line to reveal a sloping resistance barrier. This downswing in the technical indicator suggests it is ready for a breakout to the upside.

If this move were to occur, MATIC price would see a significant rise in buying pressure that propels it past the range high at $1.80 and tags the resistance barrier at $2.06. This upswing would constitute a 25% climb.

MATIC/USDT 1-day chart

MATIC/USDT 1-day chart

While things are looking good for MATIC price, a breakdown of the midpoint at $1.42 will indicate that Polygon is heading into a discount phase. A failure to make a quick comeback above $1.42 will indicate that the downswing could extend to the immediate demand zone ranging from $1.15 to $1.24.

Here, the buyers can give the upswing another go. However, a daily close below $1.15 will invalidate the bullish thesis and trigger a correction to the range low at $1.05.


Information on these pages contains forward-looking statements that involve risks and uncertainties. Markets and instruments profiled on this page are for informational purposes only and should not in any way come across as a recommendation to buy or sell in these assets. You should do your own thorough research before making any investment decisions. FXStreet does not in any way guarantee that this information is free from mistakes, errors, or material misstatements. It also does not guarantee that this information is of a timely nature. Investing in Open Markets involves a great deal of risk, including the loss of all or a portion of your investment, as well as emotional distress. All risks, losses and costs associated with investing, including total loss of principal, are your responsibility. The views and opinions expressed in this article are those of the authors and do not necessarily reflect the official policy or position of FXStreet nor its advertisers. The author will not be held responsible for information that is found at the end of links posted on this page.

If not otherwise explicitly mentioned in the body of the article, at the time of writing, the author has no position in any stock mentioned in this article and no business relationship with any company mentioned. The author has not received compensation for writing this article, other than from FXStreet.

FXStreet and the author do not provide personalized recommendations. The author makes no representations as to the accuracy, completeness, or suitability of this information. FXStreet and the author will not be liable for any errors, omissions or any losses, injuries or damages arising from this information and its display or use. Errors and omissions excepted.

The author and FXStreet are not registered investment advisors and nothing in this article is intended to be investment advice.

Join Telegram

Recommended content


Recommended Content

Editors’ Picks

Ripple on-chain metrics show bullish signs amidst legal struggle with SEC, XRP eyes recovery

Ripple on-chain metrics show bullish signs amidst legal struggle with SEC, XRP eyes recovery

Ripple made a comeback above $0.48 on Tuesday and hovers above that level in Wednesday’s European session. Ripple on-chain metrics such as transaction volume and Network Realized Profit/Loss have turned bullish, supporting a recovery in the altcoin. 

More Ripple News

Bitcoin price falls amidst German government transfers, miners activity

Bitcoin price falls amidst German government transfers, miners activity

Bitcoin (BTC) extends correction on Wednesday and hovers around $61,000 after finding resistance near the $64,000 level on Monday. Recent on-chain data indicates heightened selling activity from Bitcoin miners early in the week. 

More Bitcoin News

Crypto Today: Bitcoin erases gains from end of June, Ethereum declines while Ripple holds

Crypto Today: Bitcoin erases gains from end of June, Ethereum declines while Ripple holds

Bitcoin wipes out gains from the last week of June and falls below $60,000 on Wednesday. Ethereum and top altcoins ranked by market capitalization erased gains as the inflation outlook worsened. Ripple holds on to recent gains and hovers above $0.48 on Wednesday. 

More Cryptocurrencies News

Three reasons why altcoins could shake off losses this week

Three reasons why altcoins could shake off losses this week

On-chain data from Santiment shows that altcoins are currently in the opportunity zone, or generating buy signals. The top three altcoins in the buy zone are Basic Attention Token (BAT), Chromia (CHR), and Highstreet (HIGH), per Santiment. 

More Altcoins News

Bitcoin: BTC price correction could end in July, according to seasonal data

Bitcoin: BTC price correction could end in July, according to seasonal data

Bitcoin (BTC) price appears poised for a decline this week, influenced by slight outflows in US spot ETFs, selling activity among BTC miners, and a combined transfer of 4,690.28 BTC to centralized exchanges by the US and German governments.

Read full analysis

BTC

ETH

XRP