MATIC price threatens a 45% crash; this is what traders can do
- MATIC price has breached the $0.674 support level after trading above it for nearly a year.
- This breakdown could crash Polygon by another 45% to $0.301 before buyers step in.
- A three-day candlestick close above $1.05 will invalidate the bearish thesis.

MATIC price is in a tough spot like many altcoins after the recent collapse of LUNA-UST. The ripple effect of this breakdown is being felt in the crypto space across every single token, including Bitcoin.
MATIC price needs a breather
MATIC price has crashed 57% in under ten days and flipped the $1.05 and $0.674 support levels into a resistance barrier. This massive crash has caught many investors off-guard. The crash is likely to limit Polygon’s movements.
As seen in the chart below, MATIC price is likely to trade between the $0.301 and the $0.674 barriers. The $0.40 will be a cushion, preventing it from crashing to the lower limit. However, if things continue to go the way they are, there is a good chance Polygon could crash another 45% and tag $0.301.
While this move could seem bearish, a decisive three-day candlestick close below the $0.301 barrier will trigger an 84% crash to $0.046. This move, while extreme, is likely, especially if Bitcoin price crashes below $19,500.
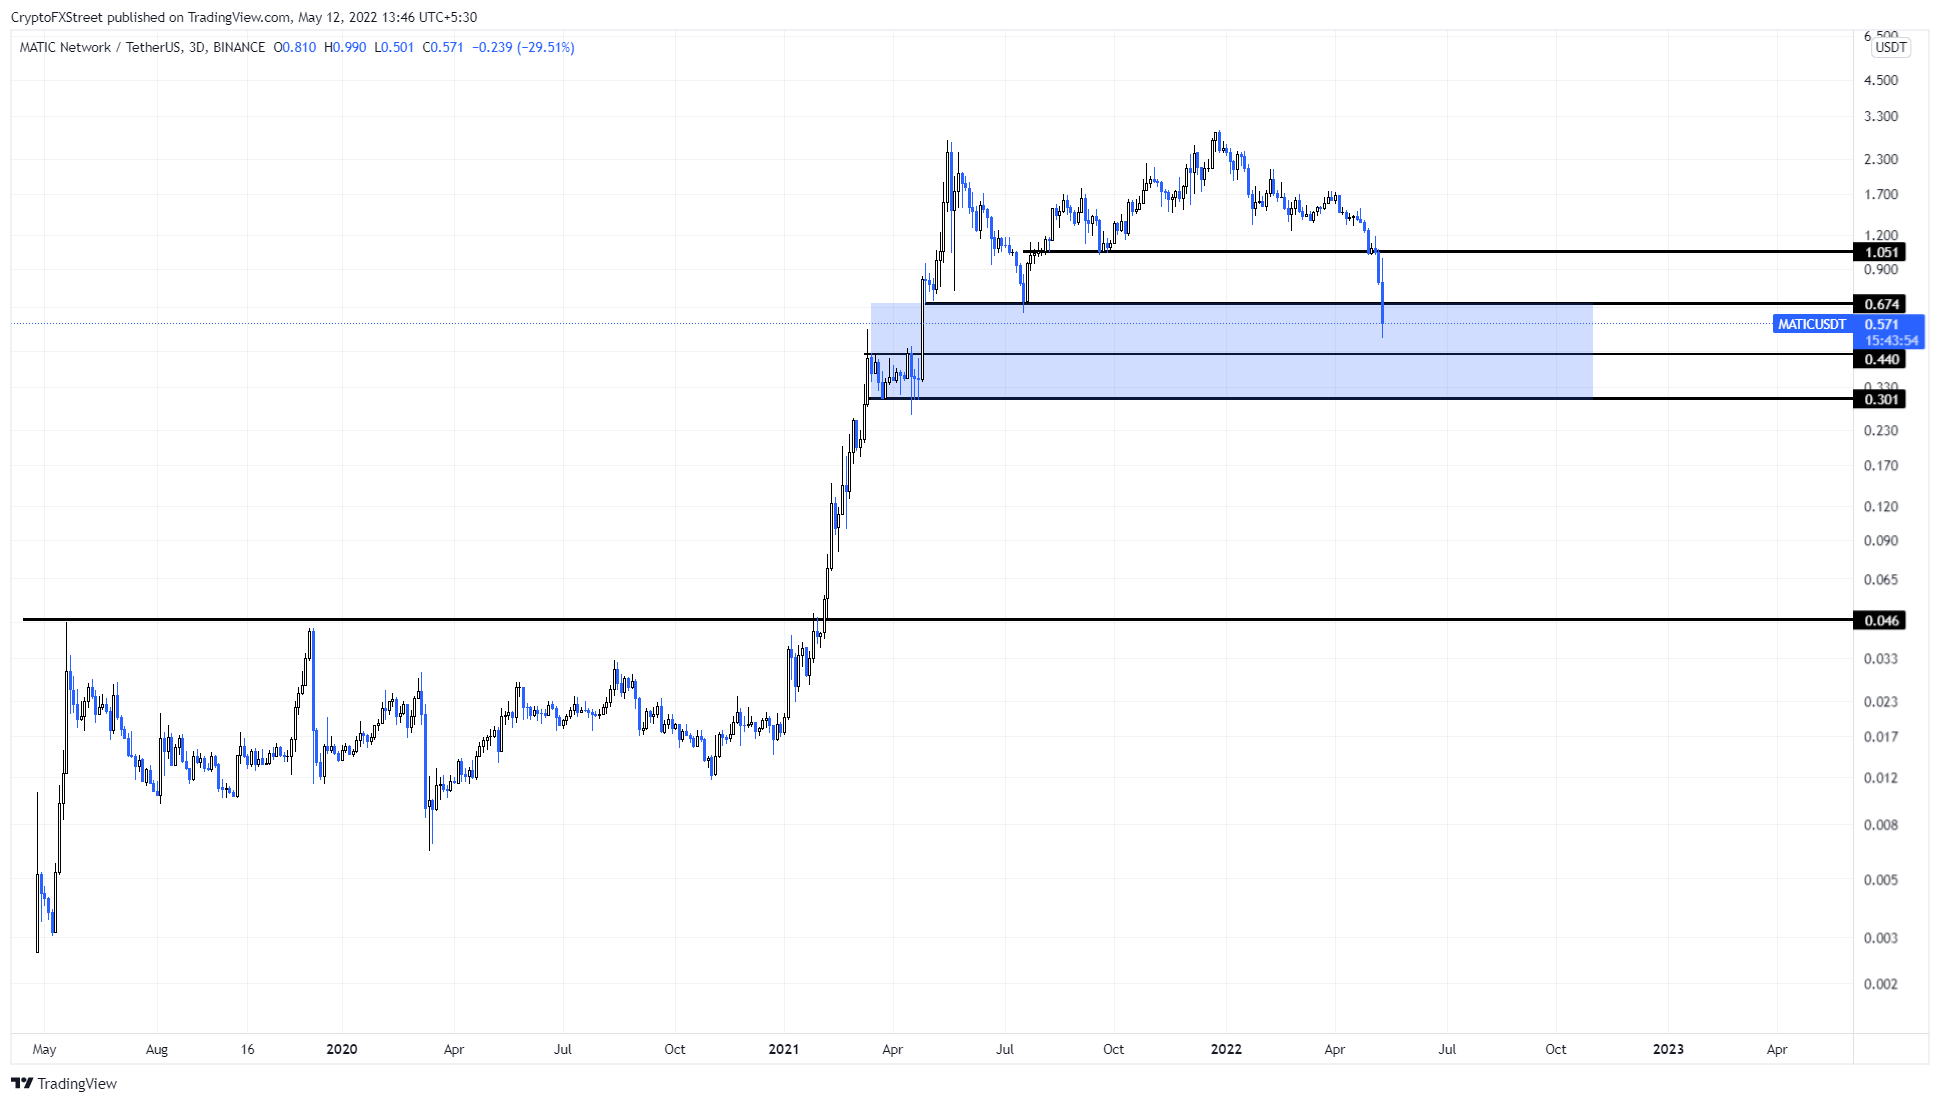
MATIC/USDT 3-day chart
The crypto markets are in shambles and altcoins, including Polygon, are badly down. MATIC price has breached stable support levels, indicating that this trend will continue. However, if buyers band together and overcome the selling pressure, there is a chance of a recovery.
In such a case, a three-day candlestick close above $1.05 will invalidate the bearish thesis for MATIC price. This development could see Polygon rally to $1.05.
Author

Akash Girimath
FXStreet
Akash Girimath is a Mechanical Engineer interested in the chaos of the financial markets. Trying to make sense of this convoluted yet fascinating space, he switched his engineering job to become a crypto reporter and analyst.


