MATIC price resumes correction, as Polygon eyes acceptance below this key level


  • MATIC price is set to extend correction from two-month highs.
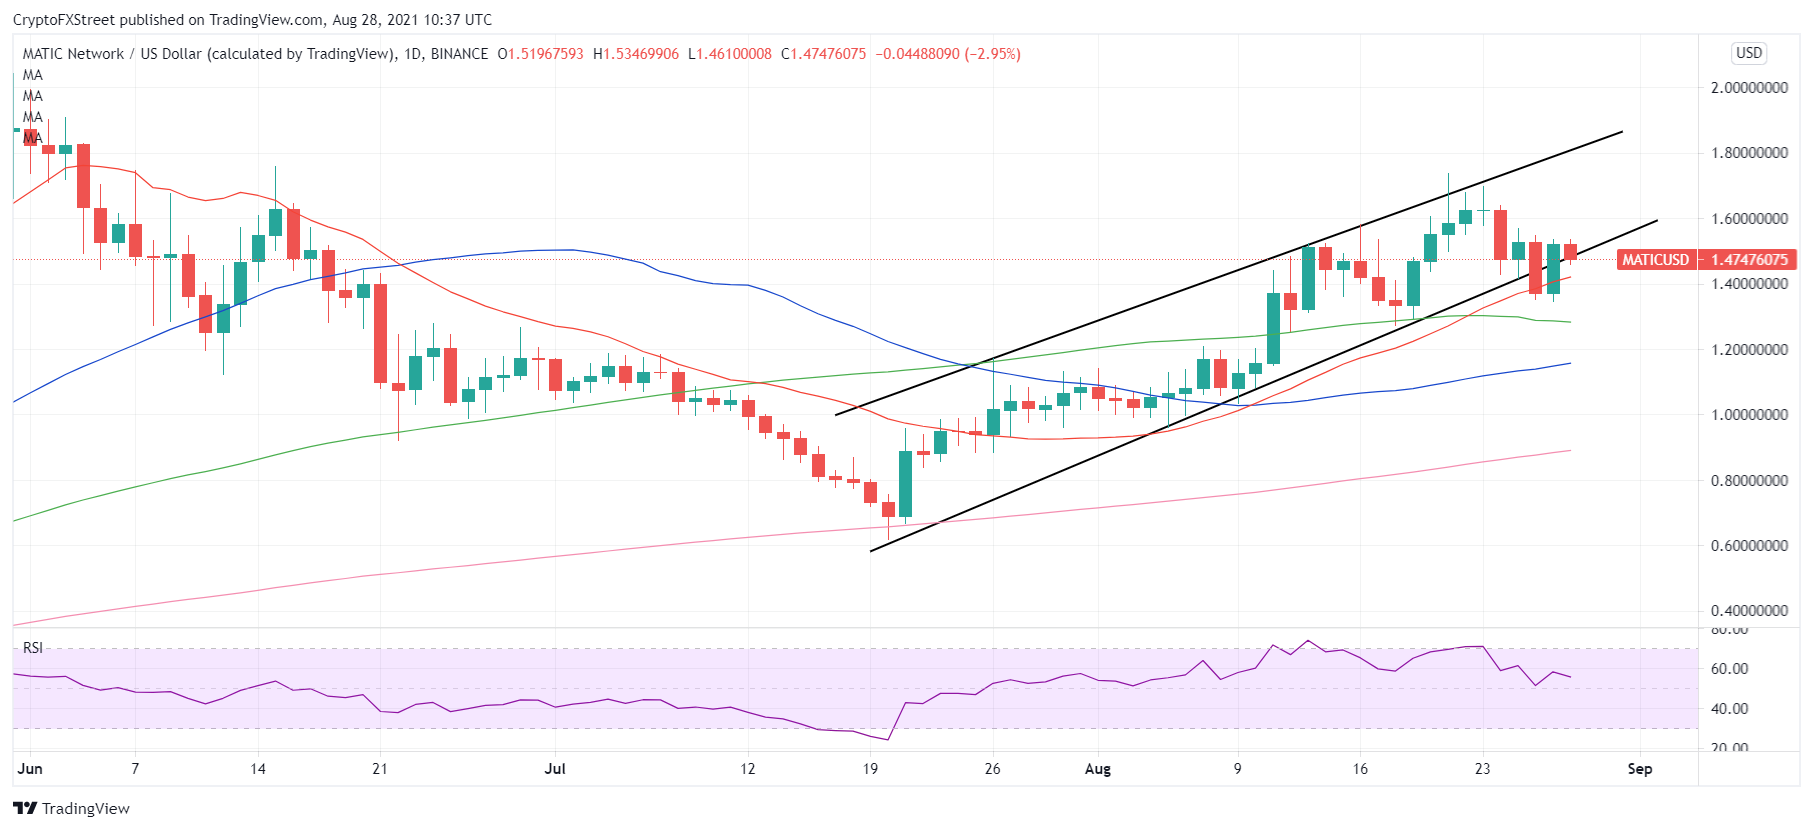
  • Polygon charts a rising wedge breakdown on the daily sticks.
  • Acceptance below 21-DMA is crucial, as RSI still keeps the bullish zone.

MATIC/USD is back in the red zone on Saturday, having witnessed up and down trading sessions so far this week.

Over the past few trading days, MATIC price has confined itself into a tight range between $1.55-$1.35, with bulls lacking the conviction to extend the rebound from weekly lows.

The MATIC price is reversing a part of Friday’s impressive recovery, now trading around $1.48, down 2.5% on a daily basis, tracking the negative sentiment across the crypto board.

Polygon remains on a corrective decline from two-month highs of $1.74, awaiting fresh impetus for the next leg lower.

MATIC/USD: Reclaims key 21-DMA support but for how long?

From a short-term technical perspective, the downside appears more compelling for MATIC price, in light of a rising wedge breakdown confirmed on the daily sticks on Thursday.

MATIC bears extended control below the rising trendline support at $1.4406, yielding a daily closing below the latter and the critical 21-Daily Moving Average (DMA), validating the downside breakout from the rising wedge pattern.

However, the bulls fought back control on Friday and rebounded firmly, recapturing both the 21-DMA as well as pattern support now resistance.

Heading into the weekly close, sellers have returned as they look to retest the 21-DMA level, now at $1.4215.

Acceptance below that level is critical to extending the bearish reversal from above the $1.50 barrier.

Sellers will then look out for the horizontal 100-DMA support at $1.2801, below which a drop towards the mildly bullish 100-DMA at $1.1579 will be on the cards.

MATIC/USD: Daily chart

Meanwhile, the 14-day Relative Strength Index (RSI) is edging lower but remains well above the central line, warranting caution for MATIC bears.

Should the bulls defy the persisting downbeat mood and regain control a test of the recent range highs near $1.55 will be inevitable.

Buyers will seek fresh entries above the last, calling for a fresh advance towards the August 24 high of $1.64. Ahead of that hurdle, the $1.60 round number could be probed.


Information on these pages contains forward-looking statements that involve risks and uncertainties. Markets and instruments profiled on this page are for informational purposes only and should not in any way come across as a recommendation to buy or sell in these assets. You should do your own thorough research before making any investment decisions. FXStreet does not in any way guarantee that this information is free from mistakes, errors, or material misstatements. It also does not guarantee that this information is of a timely nature. Investing in Open Markets involves a great deal of risk, including the loss of all or a portion of your investment, as well as emotional distress. All risks, losses and costs associated with investing, including total loss of principal, are your responsibility. The views and opinions expressed in this article are those of the authors and do not necessarily reflect the official policy or position of FXStreet nor its advertisers. The author will not be held responsible for information that is found at the end of links posted on this page.

If not otherwise explicitly mentioned in the body of the article, at the time of writing, the author has no position in any stock mentioned in this article and no business relationship with any company mentioned. The author has not received compensation for writing this article, other than from FXStreet.

FXStreet and the author do not provide personalized recommendations. The author makes no representations as to the accuracy, completeness, or suitability of this information. FXStreet and the author will not be liable for any errors, omissions or any losses, injuries or damages arising from this information and its display or use. Errors and omissions excepted.

The author and FXStreet are not registered investment advisors and nothing in this article is intended to be investment advice.

Join Telegram

Recommended content


Recommended Content

Editors’ Picks

Ripple on-chain metrics show bullish signs amidst legal struggle with SEC, XRP eyes recovery

Ripple on-chain metrics show bullish signs amidst legal struggle with SEC, XRP eyes recovery

Ripple made a comeback above $0.48 on Tuesday and hovers above that level in Wednesday’s European session. Ripple on-chain metrics such as transaction volume and Network Realized Profit/Loss have turned bullish, supporting a recovery in the altcoin. 

More Ripple News

Bitcoin price falls amidst German government transfers, miners activity

Bitcoin price falls amidst German government transfers, miners activity

Bitcoin (BTC) extends correction on Wednesday and hovers around $61,000 after finding resistance near the $64,000 level on Monday. Recent on-chain data indicates heightened selling activity from Bitcoin miners early in the week. 

More Bitcoin News

Crypto Today: Bitcoin erases gains from end of June, Ethereum declines while Ripple holds

Crypto Today: Bitcoin erases gains from end of June, Ethereum declines while Ripple holds

Bitcoin wipes out gains from the last week of June and falls below $60,000 on Wednesday. Ethereum and top altcoins ranked by market capitalization erased gains as the inflation outlook worsened. Ripple holds on to recent gains and hovers above $0.48 on Wednesday. 

More Cryptocurrencies News

Three reasons why altcoins could shake off losses this week

Three reasons why altcoins could shake off losses this week

On-chain data from Santiment shows that altcoins are currently in the opportunity zone, or generating buy signals. The top three altcoins in the buy zone are Basic Attention Token (BAT), Chromia (CHR), and Highstreet (HIGH), per Santiment. 

More Altcoins News

Bitcoin: BTC price correction could end in July, according to seasonal data

Bitcoin: BTC price correction could end in July, according to seasonal data

Bitcoin (BTC) price appears poised for a decline this week, influenced by slight outflows in US spot ETFs, selling activity among BTC miners, and a combined transfer of 4,690.28 BTC to centralized exchanges by the US and German governments.

Read full analysis

BTC

ETH

XRP