MATIC price primed for 80% breakout as Polygon approaches critical resistance
- MATIC price is traversing an ascending triangle pattern and is edging closer to a breakout.
- A decisive close above the $1.71 resistance level will confirm the start of an uptrend.
- If Polygon fails to hold above $1.21, it will invalidate the bullish thesis.

MATIC price has been consolidating for roughly four months and is currently approaching an inflection point. A breakout from this congestion will reward patient investors with a massive bull rally.
MATIC price prepares for bullish move
MATIC price set up three higher highs and two equal highs from June 15 to October 19. Connecting these swing points using trend lines reveals the formation of an ascending triangle pattern.
This technical formation forecasts a 61% ascent to $2.75, determined by adding the distance between the first swing high and swing low to the breakout point at $1.71. This climb would constitute an 80% gain from the current position.
While the possibility of gains is massive, investors need to wait for a successful flip of the horizontal resistance level at $1.71. A retest of this barrier as a support floor will serve as a secondary confirmation and signal the start of a new uptrend for MATIC price. Market participants need to note that the $2.21 resistance level needs to be cleared for Polygon bulls to have a chance at setting up a new all-time high at $2.75.
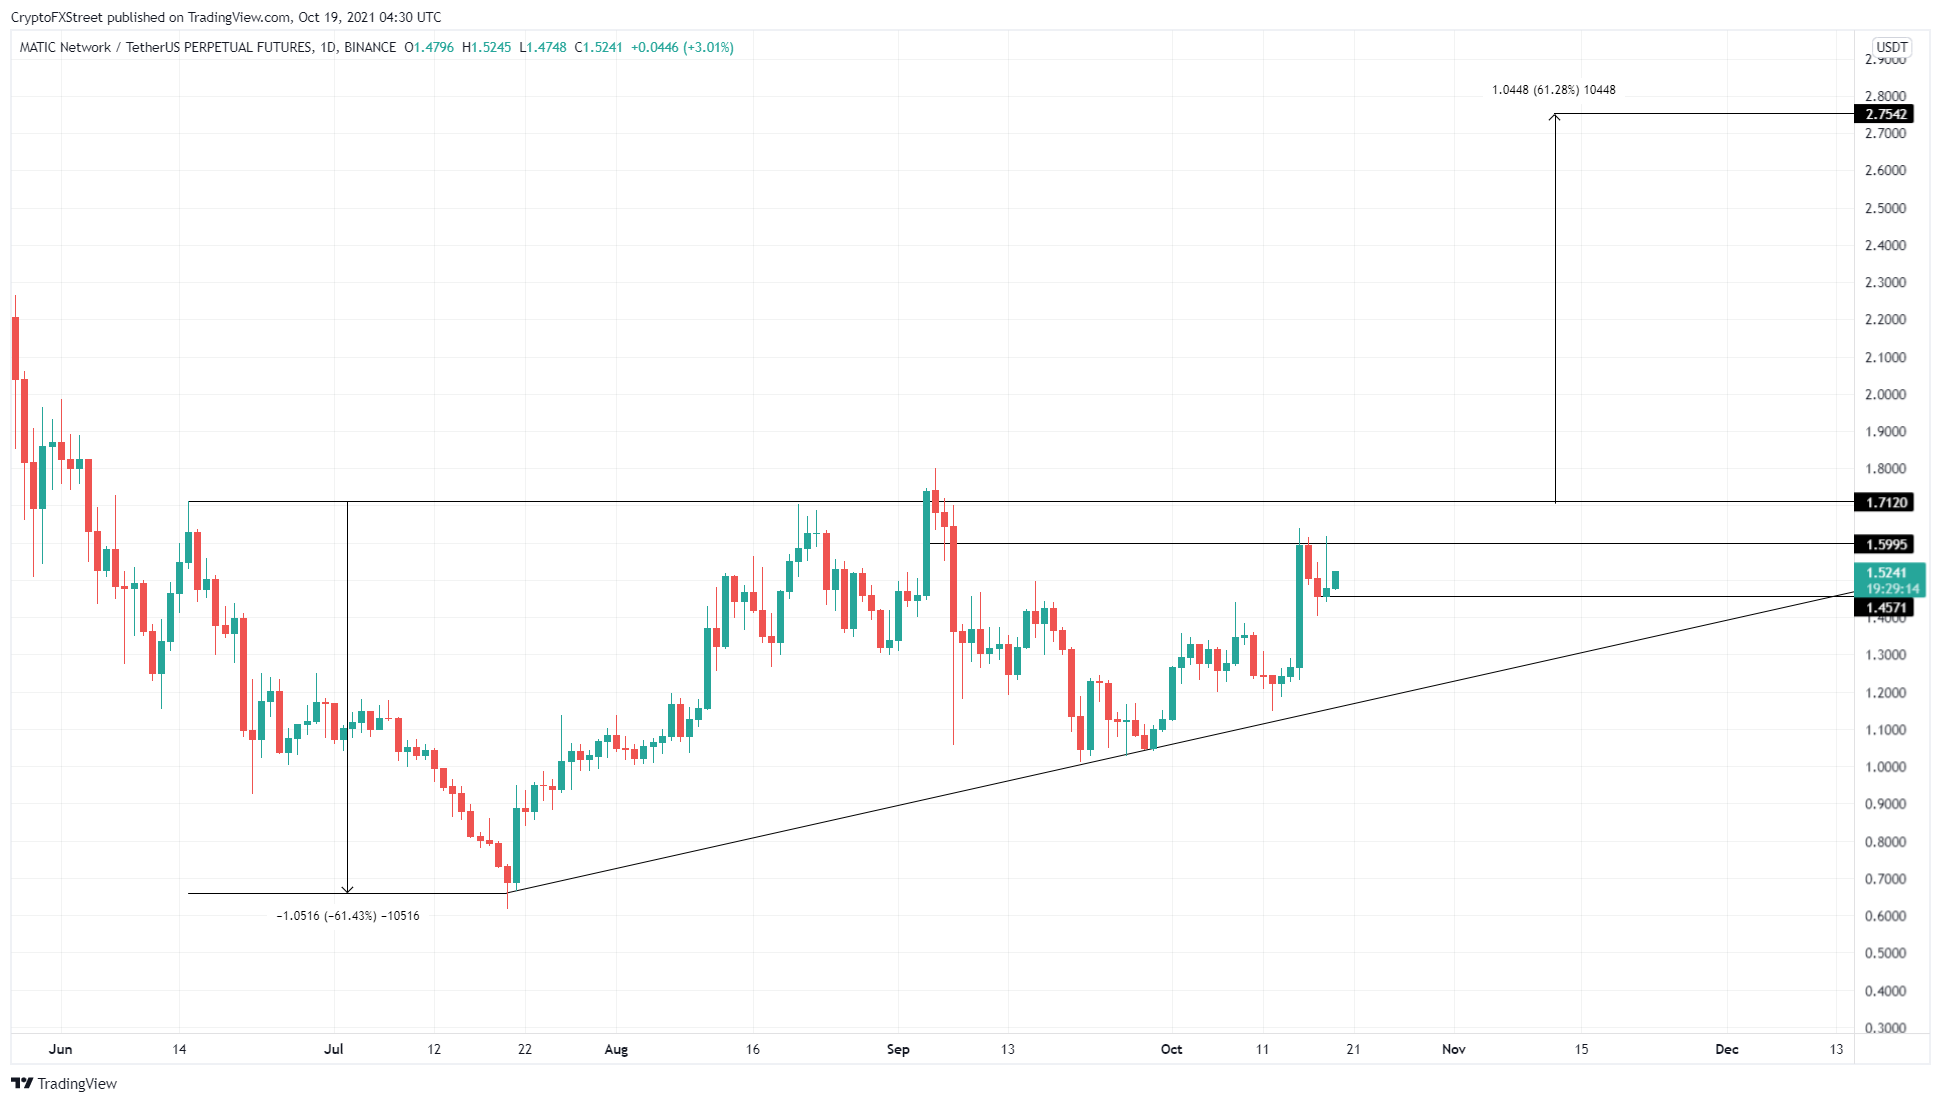
MATIC/USDT 1-day chart
On the other hand, MATIC price needs to rally at least 14% to pierce the $1.71 barrier. A failure to push through will likely result in a pullback to the inclined trend line of the ascending triangle at $1.21.
A breakdown below this level will create a lower low and invalidate the bullish thesis. In such a case, MATIC price might head toward the $1.01 support floor.
Author

Akash Girimath
FXStreet
Akash Girimath is a Mechanical Engineer interested in the chaos of the financial markets. Trying to make sense of this convoluted yet fascinating space, he switched his engineering job to become a crypto reporter and analyst.


