MATIC Price Prediction: Polygon’s inflection point could trigger a 20% move
- MATIC price has undergone a massive comeback after a nasty down-spiking wick on October 13.
- The $0.888 hurdle and whether it gets flipped will be key in determining the direction of the 20% move.
- A daily candlestick close below $0.721 will invalidate the bullish thesis.

MATIC price has been lingering inside a range for nearly three months. The recent retest of the range’s lower limits has triggered a turnaround and run-up which has a high chance of continuing.
MATIC price ready to move higher
MATIC price created the $0.721 to $1.05 range when it exploded 40% between July 26 and August 14. After weeks of hovering within these bounds, Polygon swept the range low on September 21 and recovered above it on the following day to close higher.
Since then, MATIC price has risen 22% but undid all of these gains in the following week. After forming a base on October 13 at $0.787, Polygon bulls triggered a reversal that resulted in a 22% move in the next five days.
Going forward, the range’s midpoint at $0.888 is a key level that needs to be flipped to continue the ascent. Yet the highest volume traded since April 26 seems to overlap with the range’s midpoint at $0.888, making it a tough hurdle to overcome.
If successful, investors can expect MATIC price to rally roughly 18% and retest the range high at $1.05.
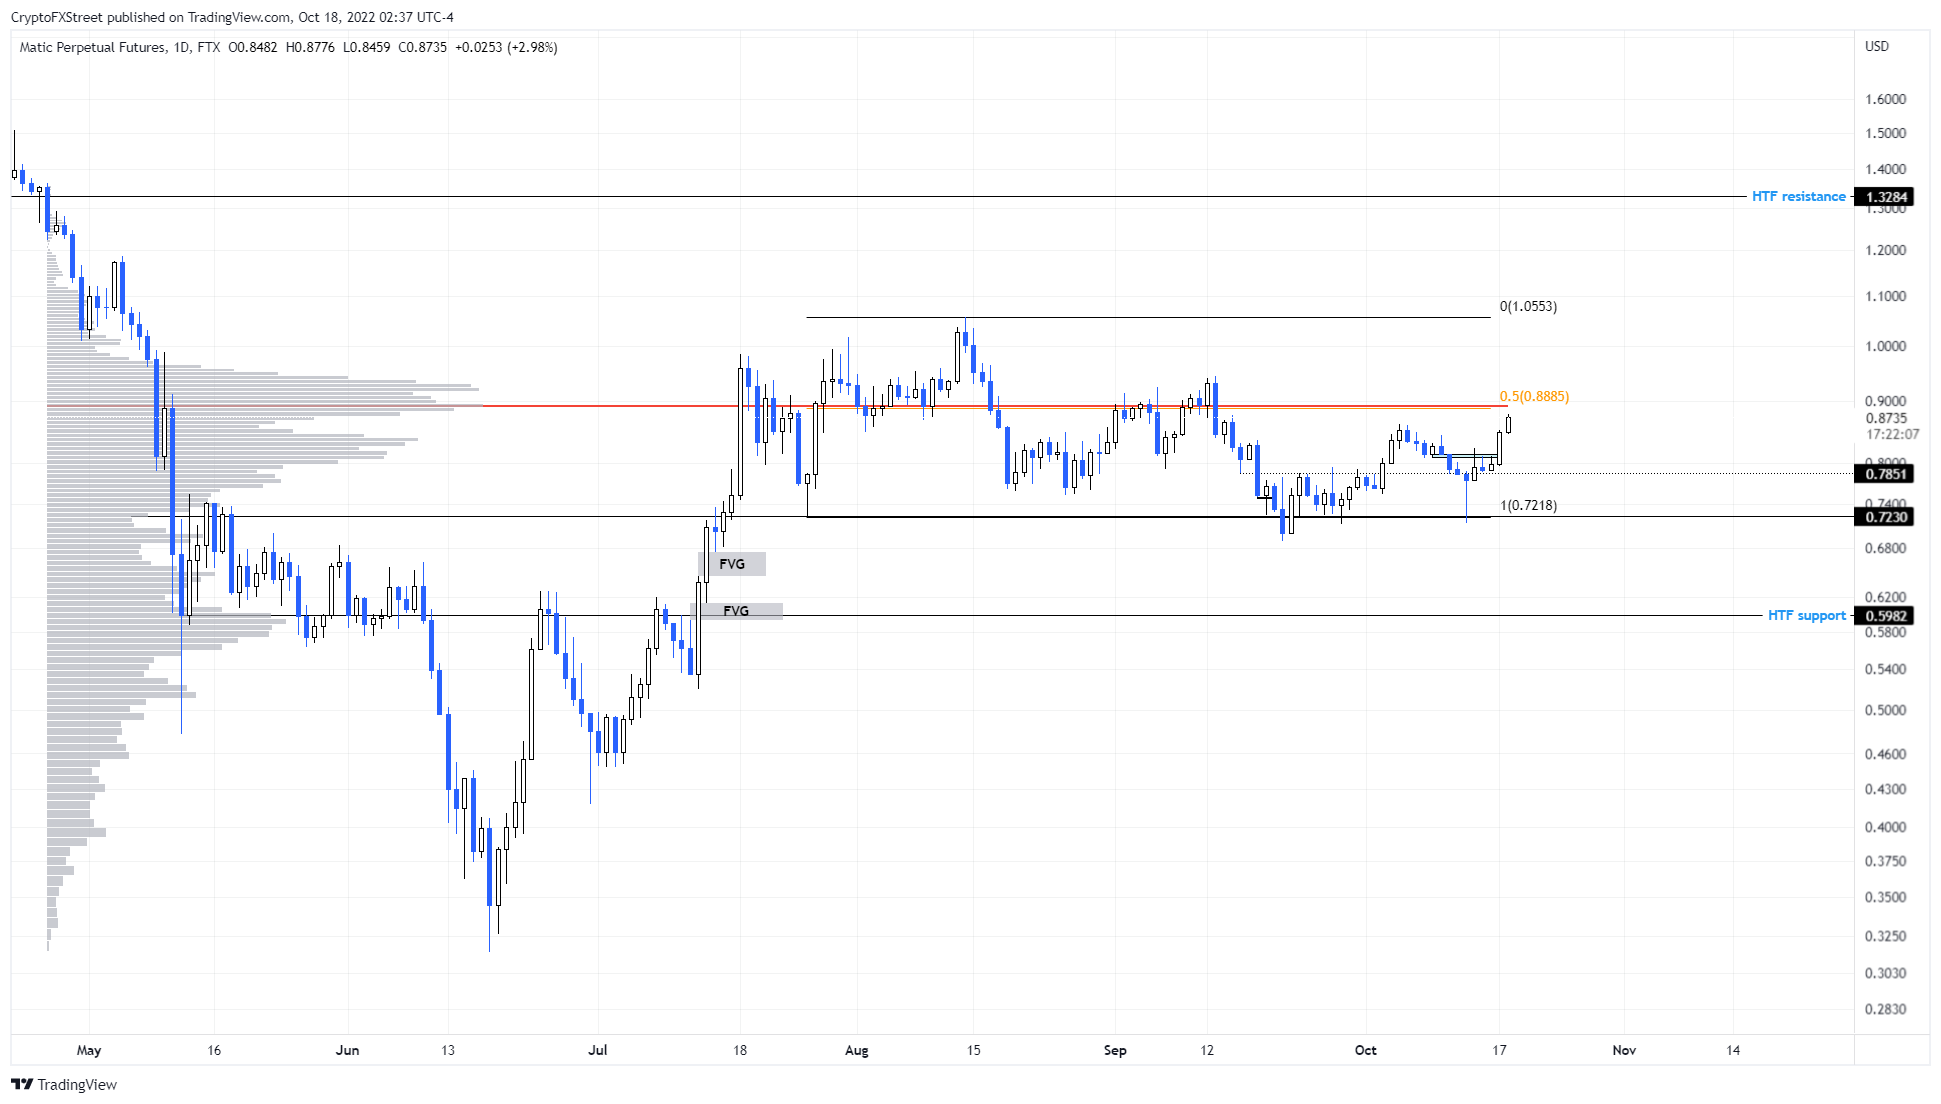
MATIC/USDT 1-day chart
Adding credence to the possibility of a range high retest is IntoTheBlock’s Global In/Out of the Money (GIOM) model. The transaction history shows that the next significant hurdle extends from $0.88 to $1.11, where roughly 45,200 addresses that purchased nearly 970 million MATIC tokens are “Out of the Money.”
Therefore, a spike in buying pressure that pushes MATIC price up into this area is likely to face immense selling pressure from underwater investors wanting to break even. This outlook aligns perfectly with the forecast from a technical perspective, indicating that a flip of $0.888 is crucial to the 18% upswing.
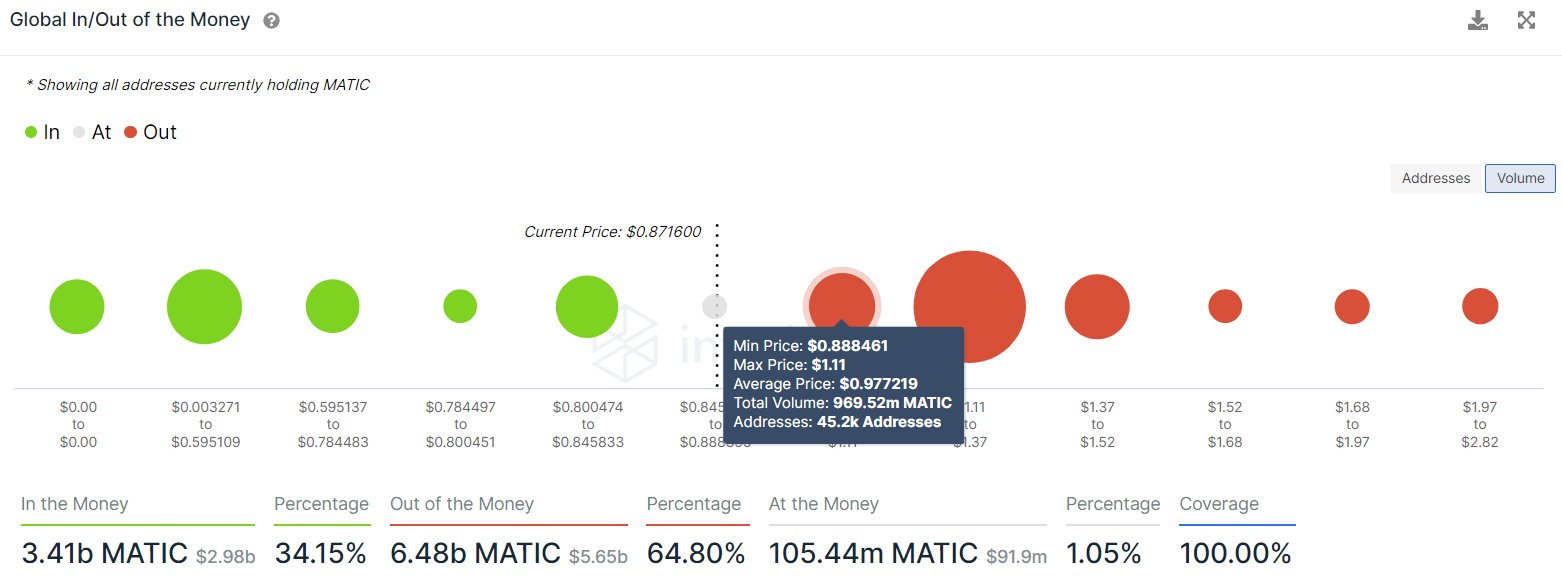
MATIC GIOM
Regardless of the obvious bullish signs, MATIC price needs to overcome the $0.888 hurdle. Therefore, interested investors need to anticipate a pullback should Polygon bulls fail to tear through the said resistance level.
A positive outcome here could include a 12% pullback that retests the $0.785 support level. Here, buyers have another chance to make a comeback, but failing to do so could result in the start of a bearish move instead.
A daily candlestick close below the $0.721 support level will invalidate the bullish thesis and trigger a 17% downswing to $0.598.
Author

Akash Girimath
FXStreet
Akash Girimath is a Mechanical Engineer interested in the chaos of the financial markets. Trying to make sense of this convoluted yet fascinating space, he switched his engineering job to become a crypto reporter and analyst.


