MATIC Price Prediction: Polygon to continue ascending after partnering with dotmoovs
- Polygon announced a collaboration with Dotmoovs, helping the latter scale using L2 solutions.
- MATIC price recovery has been quick, but a minor retracement could ensue before a swing high.
- A breakdown of the support level at $1.192 will invalidate the bullish thesis and kick-start a downtrend.

Polygon has consistently partnered with multiple blockchain projects by helping them scale using their L2 solutions while improving their fundamentals. The recent collaboration with Dotmoovs is one of many that have pushed MATIC price to appreciate quickly despite the brutal sell-offs on May 19 and May 23.
Dotmoovs chooses Polygon to scale
In a recent announcement, Dotmoovs revealed that their partnership with Polygon is mainly to leverage its scalability power to help users receive NFT rewards in a seamless transactional experience.
Dotmoovs is the first cryptocurrency mobile worldwide competitive environment where users can compete with other players.
With AI-powered referees, training or practice can become competitions with rewards.
Expanding on the reason for this partnership, the blog adds,
Polygon combines the best of Ethereum and sovereign blockchains into a full-fledged multi-chain system. It solves pain points associated with blockchains, like high gas fees and slow speeds, without sacrificing on security.
With Polygon’s one-click deployment, interoperability and other features, partnerships like these will likely follow, strengthening the use-case for MATIC.
MATIC price stumbles but aims to climb higher
MATIC price is consolidating after rallying nearly 165% in less than 24 hours. This massive upswing has already undone the crash on May 23 and is only a 45% climb away from recovering the May 19 levels before the sell-off.
On the 4-hour chart, the Momentum Reversal Indicator (MRI) has flashed a sell signal in the form of a red ‘one’ candlestick. This technical formation forecasts a one-to-four candlestick correction.
This setup could push the L2 scaling token down by 15% to the 100 four-hour SMA at $1.44. Here buyers are likely to scoop up MATIC for a discount, pushing it back above the 50 four-hour SMA at $1.67.
While the above scenario is realistic, considering the massive demand for Polygon, the correction might never slide below $1.67.
Such a move would signal the presence of buyers who could further catapult MATIC price up by 45% to tag the next resistance level at $2.44.
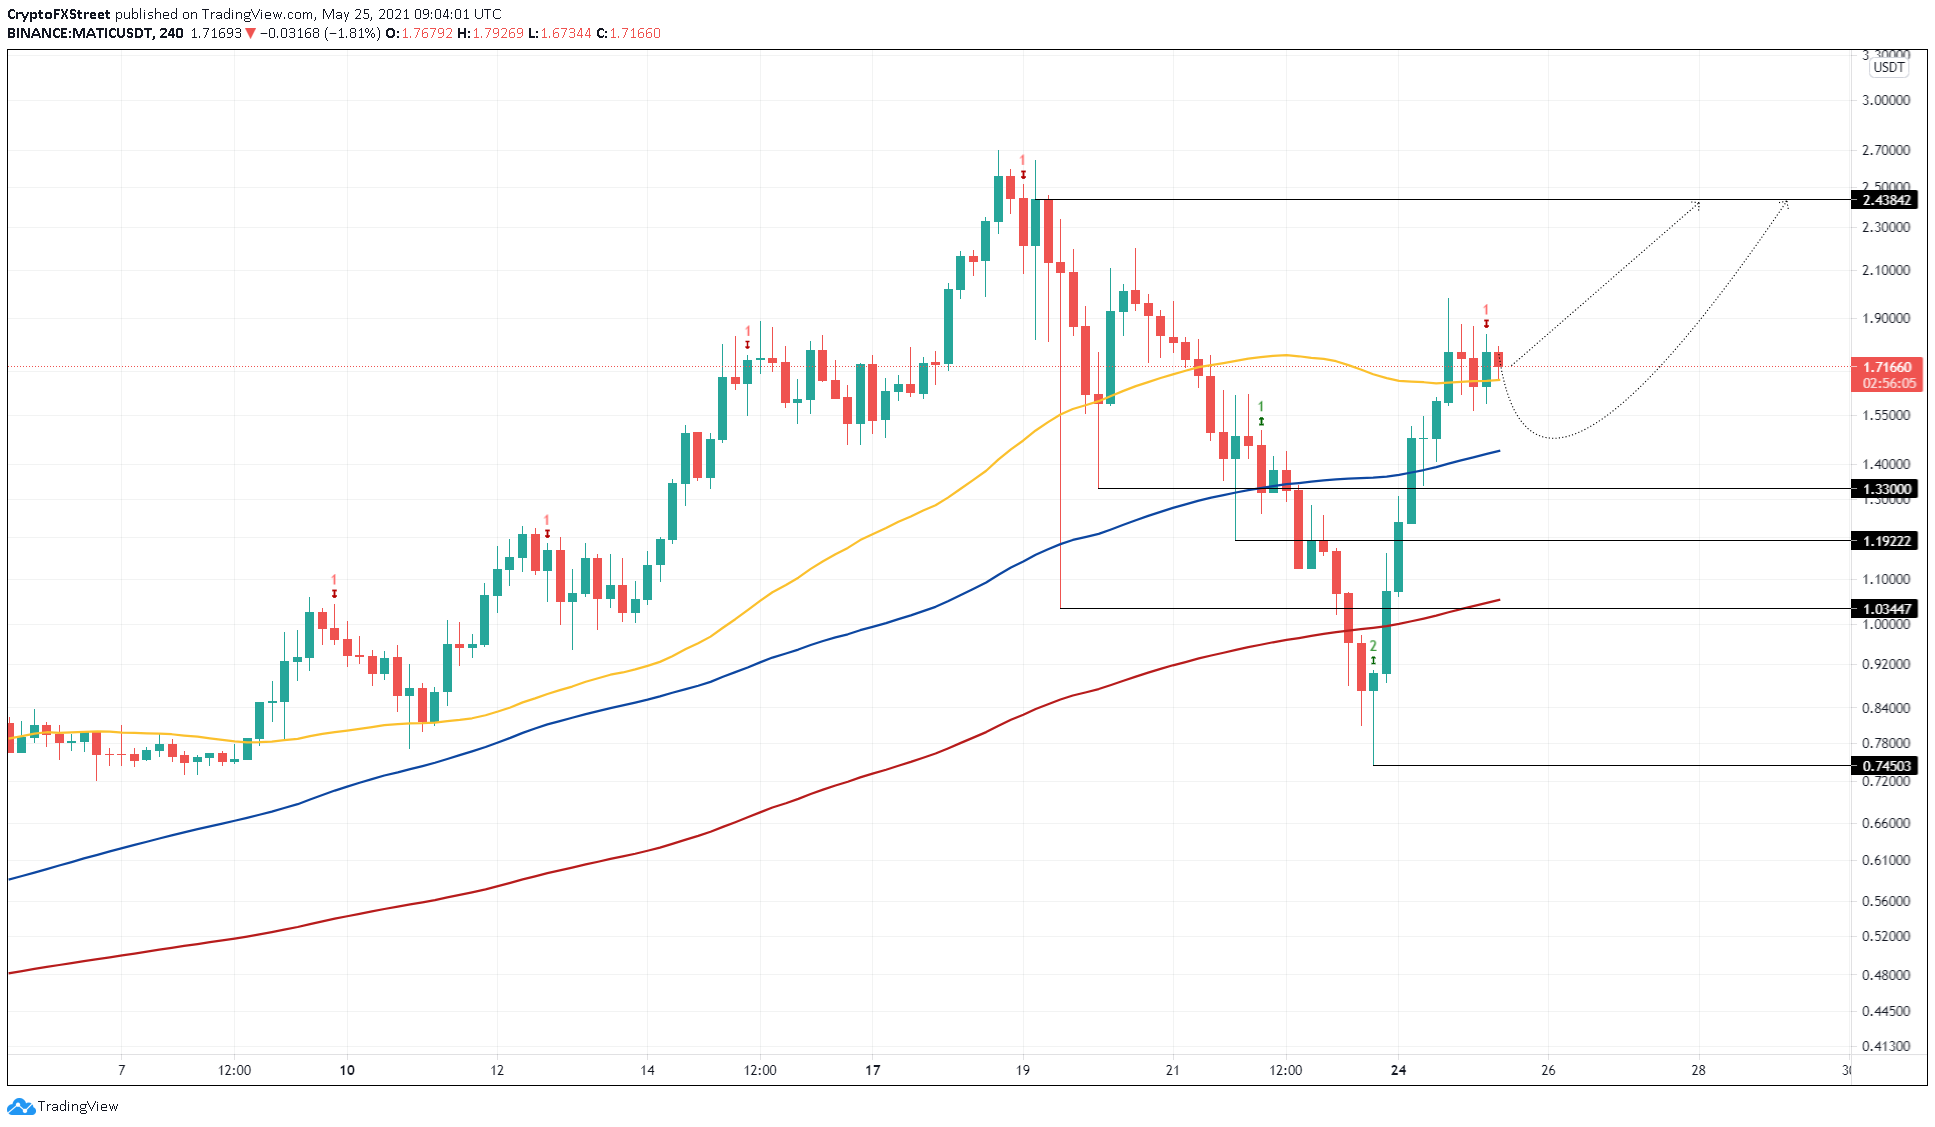
MATIC/USDT 4-hour chart
If the correction persists due to the MRI’s sell signal slide below the 100 four-hour SMA at $1.44, it will indicate weakening buying pressure.
A resolute four-hour candlestick close below $1.44 will invalidate the bullish outlook and might kick-start a 12% correction to the 200 four-hour SMA At $1.05.
Author

Akash Girimath
FXStreet
Akash Girimath is a Mechanical Engineer interested in the chaos of the financial markets. Trying to make sense of this convoluted yet fascinating space, he switched his engineering job to become a crypto reporter and analyst.


