MATIC Price Prediction: Polygon success story hangs in the balance
- MATIC price drops 13%, engages critical support, including the 2021 rising trend line.
- Polygon symmetrical triangle breakout on June 15 may have been a bull trap.
- Select on-chain metrics support a constructive view on the Indian blockchain platform.

MATIC price, once again, displayed relative strength with the June 15 breakout from a symmetrical triangle. Still, the bullish price action has quickly faded, pushing Polygon to a critical area of support. The digital asset needs the current price range to hold or risks breaking the longstanding trend line from the beginning of 2021.
MATIC price gains now appear temporary, as cryptocurrency complex turns red
MATIC price jumped almost 60% from the June 12 low until the June 15 high, breaking with the indecisive tendencies of most altcoins. Volume increased during the brief streak higher, but it fell well short of the level that accompanied the rebound off the May 23 low, suggesting that Polygon speculators were still reluctant to engage the market with significant commitment.
MATIC price has declined almost 30% from the June 15 high, overcoming support at the 50-day simple moving average at $1.42 before the current test of the confluence of the anchored volume-weighted average price (anchored VWAP) at $1.33, with the 2021 rising trend line and the symmetrical triangle’s lower trend line.
For now, Polygon investors should wait for a daily close below the well-established support mentioned above to rethink their bullish narrative. If MATIC price closes below $1.25, it will be the initial signal that the altcoin may be readying for a new leg lower. A daily close below the June 12 low of $1.12 would be the necessary confirmation that a change in trend has occurred.
If the bullish narrative endures this retracement, Polygon market operators should visualize resistance materializing at the intersection of the psychologically important $2.00 and the May 31 high of $2.04.
An energized cryptocurrency market may carry MATIC price to the May 26 high of $2.48 and potentially, the all-time high of $2.89, recorded on May 19.
It is important to note that the bullish alternative is not forecasting a relentless advance but a measured, frequently interrupted evolution.
MATIC/USD daily chart
A close below $1.12 changes everything for MATIC price. It would be a blow to the powerful uptrend since the beginning of 2021, forcing a complete reevaluation of the bullish governing narrative for the year.
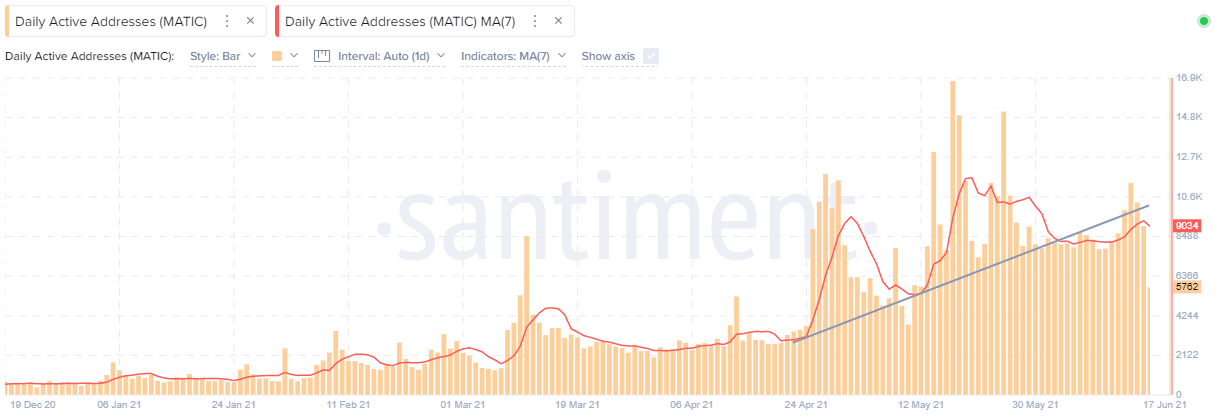
Supporting a favorable outlook for MATIC price is the Santiment Daily Active Addresses (DAA) metric that has recently turned higher. The metric shows the number of unique addresses involved in MATIC transactions daily. It indicates the daily level of crowd interaction or speculation with a token. Higher numbers tend to be bullish.
Since June 9, the daily advance addresses have turned high, accelerating the uptrend in the 7-day average that bottomed on June 5. One caveat to the metric bullishness is the break of the rising trend line for the 7-day average since the end of April. It may be nothing but this is still a factor to watch if MATIC price gains price traction.
MATIC Daily Active Addresses (DAA) - Santiment
Another complementary on-chain metric is the Santiment Supply on Exchanges metric that shows the total amount of MATIC located in known exchange wallets. Spikes in this metric tend to indicate a spike in short-term selling pressure.
Since the May high for the metric, the supply on the MATIC exchange has been declining and has crossed back below the 30-day average, suggesting the exhaustion of selling pressure in Polygon. It is an encouraging sign in a period of uncertainty and increased volatility in MATIC price.
MATIC Supply on Exchanges - Santiment
Polygon is receiving an increase in attention for its answer to some of the challenges confronted by the Ethereum blockchain, such as heavy fees, poor user experience and low transactions per minute. It is involved with the timeliest areas of cryptocurrencies, including DeFi, DApps, DAO’s and NFT’s.
Despite the flattering on-chain metrics and compelling fundamental story, MATIC price is now hanging in the balance with few remaining technical support barriers between it and a completely different script.
Author

Sheldon McIntyre, CMT
Independent Analyst
Sheldon has 24 years of investment experience holding various positions in companies based in the United States and Chile. His core competencies include BRIC and G-10 equity markets, swing and position trading and technical analysis.


