MATIC Price Prediction: Polygon sets the stage for a quick 20% upswing
- MATIC price reveals two signs hinting that a bullish is about to begin.
- Investors can expect Polygon to kick-start a 20% ascent to $1.75.
- A four-hour candlestick close below $1.30 will invalidate the bullish thesis.

MATIC price suffered a bearish fate as it encountered a breaker on its way, leading to rejection and correction on February 7. Since then, Polygon has consolidated and is currently preparing for a quick run-up.
MATIC price to pull a 180
MATIC price crashed 40% after piercing a bearish breaker, extending from $1.75 to $2.15. The resulting correction shattered the daily support level at $1.44. However, this downswing also served as a liquidity run below the January 24 swing low at $1.30, serving as the first sign that a bullish move is incoming.
The second sign is the recent uptick that pushed MATIC price to flip the $1.44 resistance level into a support level. Therefore, investors can expect Polygon to continue this ascent for another 20% and tag the lower limit of the breaker at $1.75.
In a highly bullish case, MATIC price might plow through the breaker and make a run for the weekly resistance level at $1.94. This move would constitute a 33% gain and is likely where the short-term uptrend will make a local top.
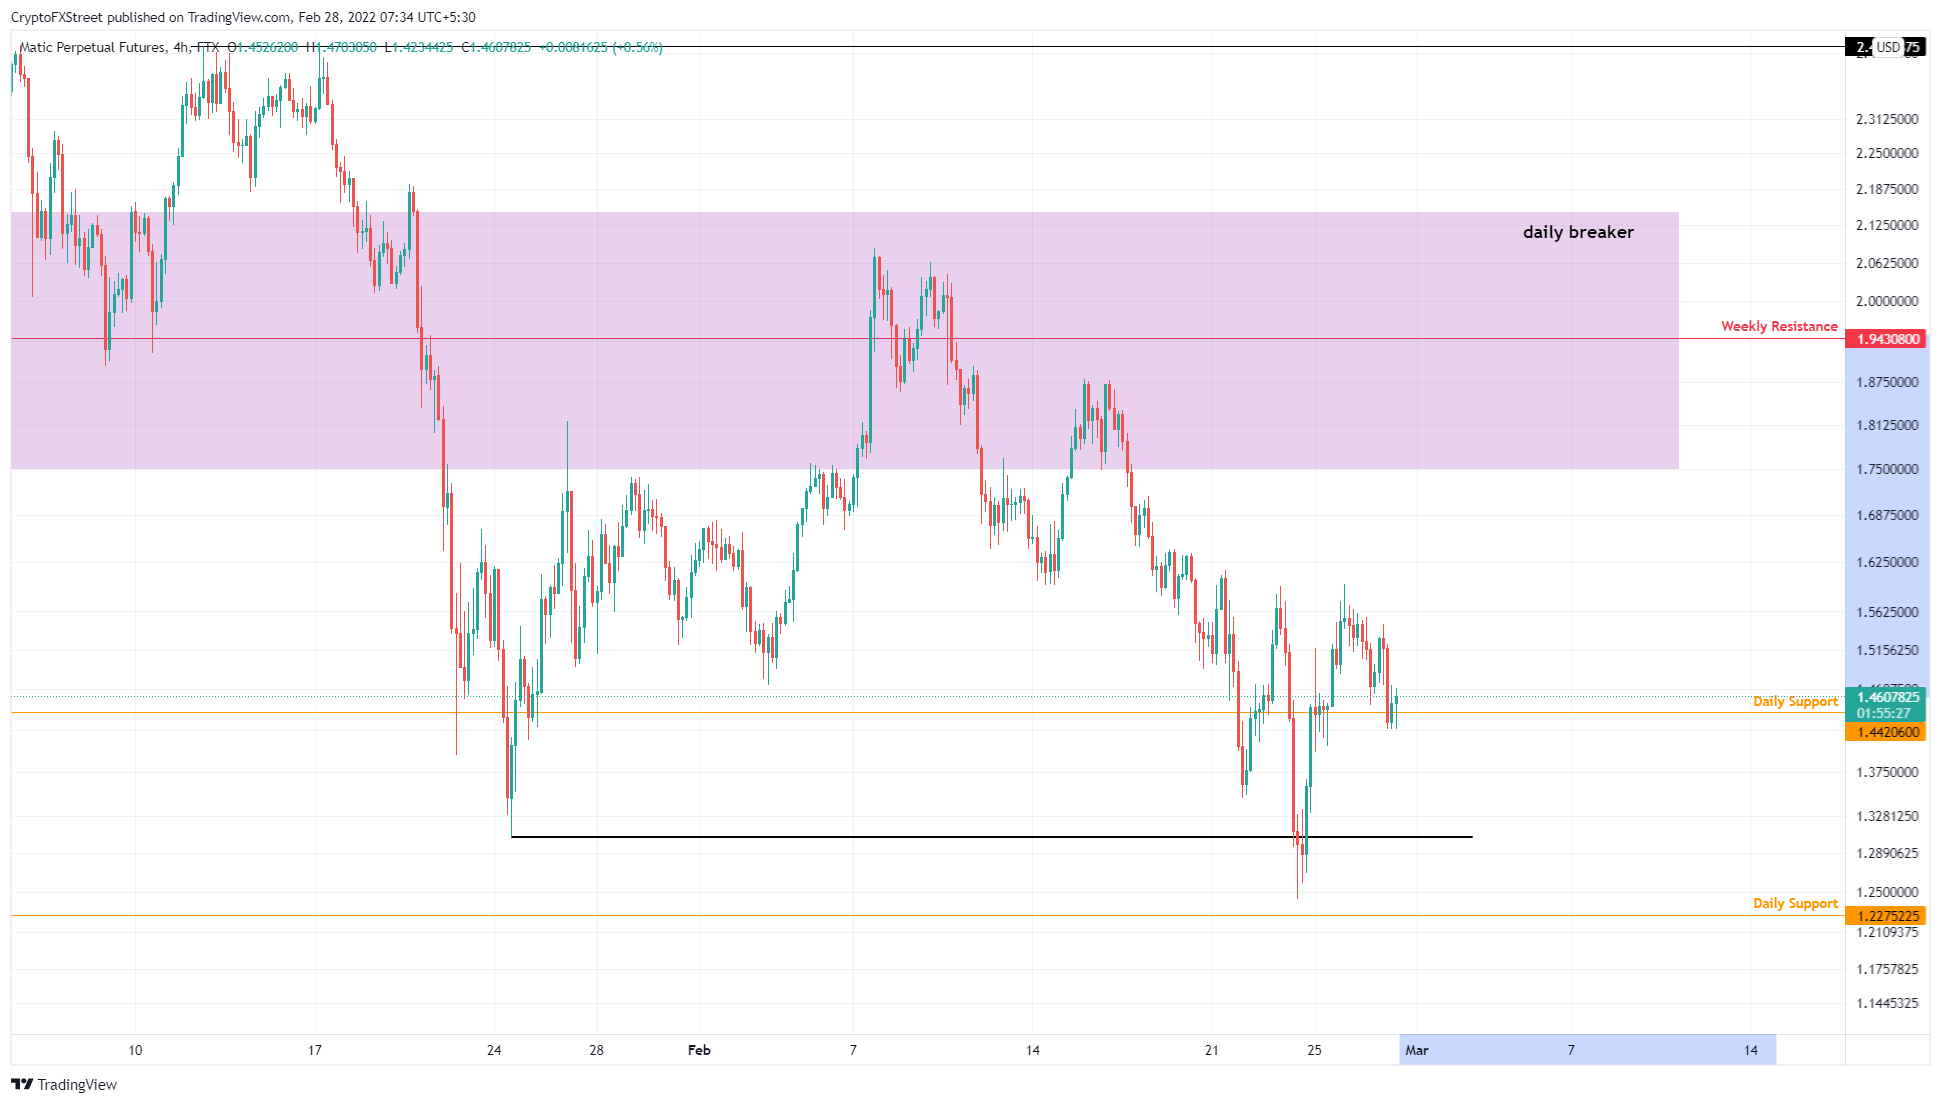
MATIC/USDT 4-hour chart
While things are looking ready for a reversal, the MATIC price needs to hold above the $1.44 support level. A breakdown of this barrier will reveal that the bulls are unwilling or unable to follow through.
In this case, if MATIC price produces a four-hour candlestick close below $1.30, it will create a lower low, invalidating the bullish thesis. This move could be key in triggering further descent to the $1.22 support level.
Author

Akash Girimath
FXStreet
Akash Girimath is a Mechanical Engineer interested in the chaos of the financial markets. Trying to make sense of this convoluted yet fascinating space, he switched his engineering job to become a crypto reporter and analyst.


