MATIC Price Prediction: Polygon looks to reverse, eyes 27% advance soon
- MATIC price slipped below the 50% Fibonacci retracement level at $1.592 but is currently recovering.
- Polygon price might explode from nearly a week-long consolidation.
- Although unlikely, a potential spike in selling pressure could delay the explosive move.

MATIC price has been on a consolidation streak for roughly a week. This range-bound movement suggests that there was no imbalance between demand and supply. However, these lateral moves are usually followed by an explosive price action that could head either way.
MATIC price to retrace to old highs
MATIC price rallied from $0.745 to $2.438 between May 23 and May 26, setting up a range for future purposes. Since then, this leg-up Polygon has been contained within it, albeit in a slow downtrend.
Typically, a bounce from the 50% Fibonacci retracement level ($1.592) is likely in a bull trending market. However, in some cases, the asset goes lower, i.e., a higher discount, which will provide a good buying opportunity. The same holds for Polygon.
Therefore, MATIC price could rise above $1.592, signaling increased buying pressure. In this case, a 15% ascent will put Polygon at $1.825.
If the momentum continues, the bulls could target $1.972, and in an optimistic case, $2.206, which is roughly 27% from the current point, $1.561.
On the other hand, investors should note that a bounce from the 70.5% Fibonacci retracement level at $1.244 is also plausible, with the upside targets remaining the same.
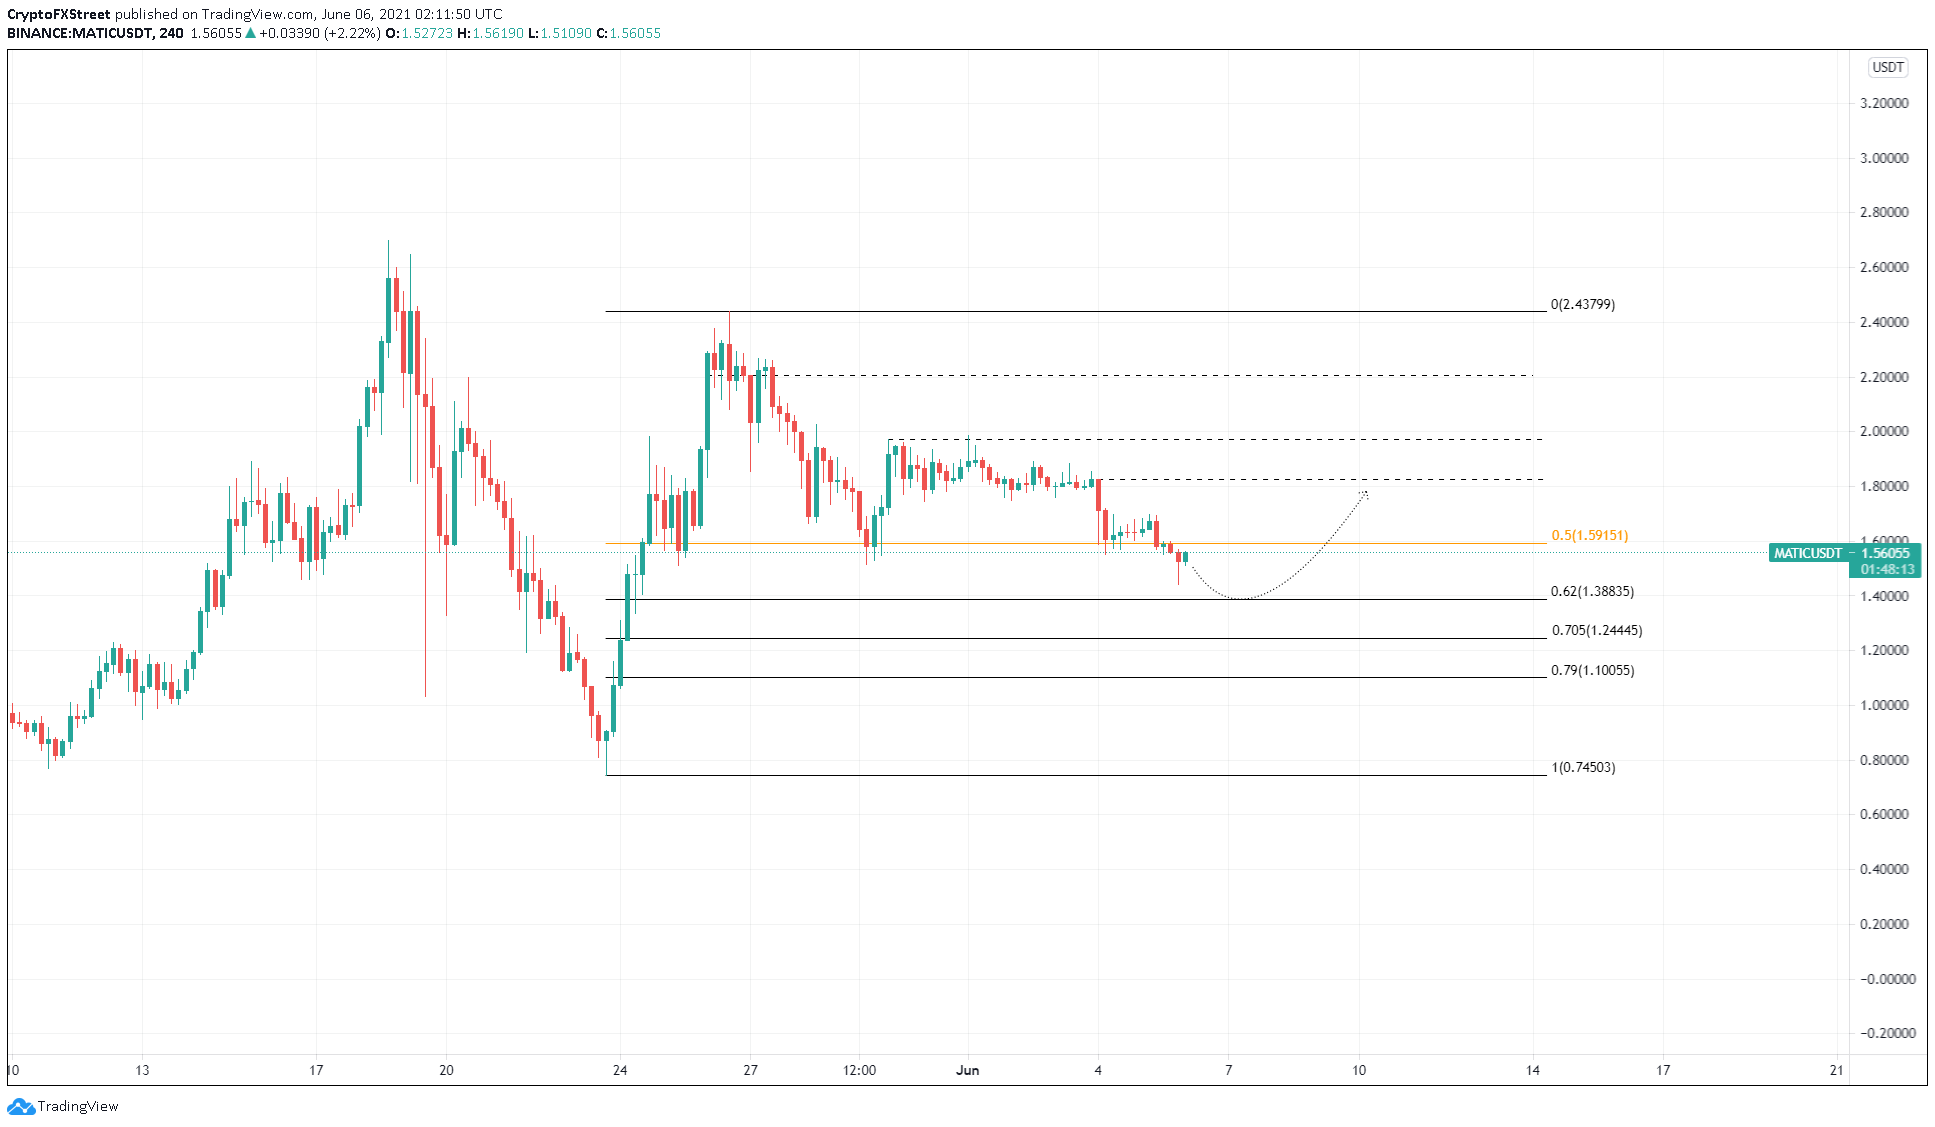
MATIC/USDT 4-hour chart
Supporting this bullish thesis is IntoTheBlock’s Global In/Out of the Money (GIOM) model, which shows a small cluster of underwater investors present at $2.13. Here, roughly 9,400 addresses that purchased nearly 100 million MATIC are “Out of the Money.”
Therefore, the bull rally might face downward pressure from these holders who might want to break even.
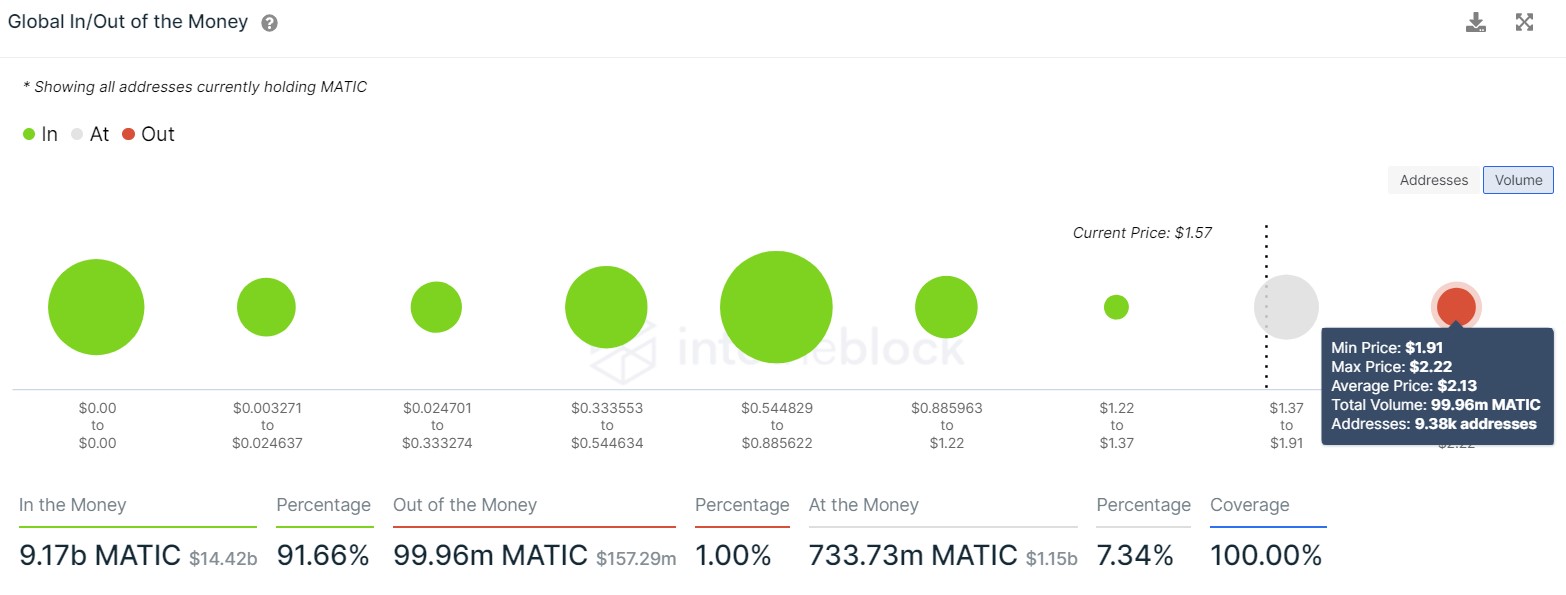
MATIC GIOM chart
While the confirmation of the upswing will arrive after MATIC price closes above $1.972, a premature rejection could hurt the bullish case.
Interestingly, the IOMAP chart shows that Polygon is currently sitting at a point where 733,000 tokens are being held by roughly 36,000 addresses, whose average buying price is $1.72. Therefore, losing this level will put a large portion of these market participants underwater and might trigger a selling pressure, pushing MATIC price lower.
In contrast, the support cluster below $1.72 is relatively small; roughly 1,650 addresses are holding 24.67 million MATIC here and might not be able to withstand the selling pressure.
In light of these events, a breakdown of $1.244 followed by extended trading below this level could invalidate the bullish hypothesis explained above.
Author

Akash Girimath
FXStreet
Akash Girimath is a Mechanical Engineer interested in the chaos of the financial markets. Trying to make sense of this convoluted yet fascinating space, he switched his engineering job to become a crypto reporter and analyst.


