MATIC Price Prediction: Polygon eyes equal highs with 11% advance
- MATIC price has rallied 12% since bottoming at $1.043 on July 2 and hints at continuing this rally.
- Polygon might witness a minor retracement before an 11% upswing.
- A breakdown of the support barrier at $1.034 will invalidate the bullish thesis.

MATIC price performance is capped by a crucial resistance level that has kept it from rising higher over five times between June 22 and June 29. Therefore, the current uptrend might face a similar rejection, preventing a flip of this barrier.
MATIC price churning toward inflection point
MATIC price set up a local bottom on June 22 at $0.927 and rallied 34.5%, slicing through a resistance barrier at $1.235. However, this move was not backed by buyers, which led to an eventual decline.
A similar turn of events occurred, making $1.235 a vital area that needs to be flipped for higher highs.
So far, Polygon has climbed roughly 12% after creating a swing low at $1.043 on July 2. After encountering the resistance ceiling at $1.165, MATIC price is retracing and will soon resume its uptrend, which might propel the altcoin higher by another 11% before it retests $1.235.
A decisive 4-hour candlestick close above this level will indicate a resurgence of buyers and might push MATIC price to tag the mid-point of the range at $1.32.
Investors should also note that rejection at $1.235 is also likely.
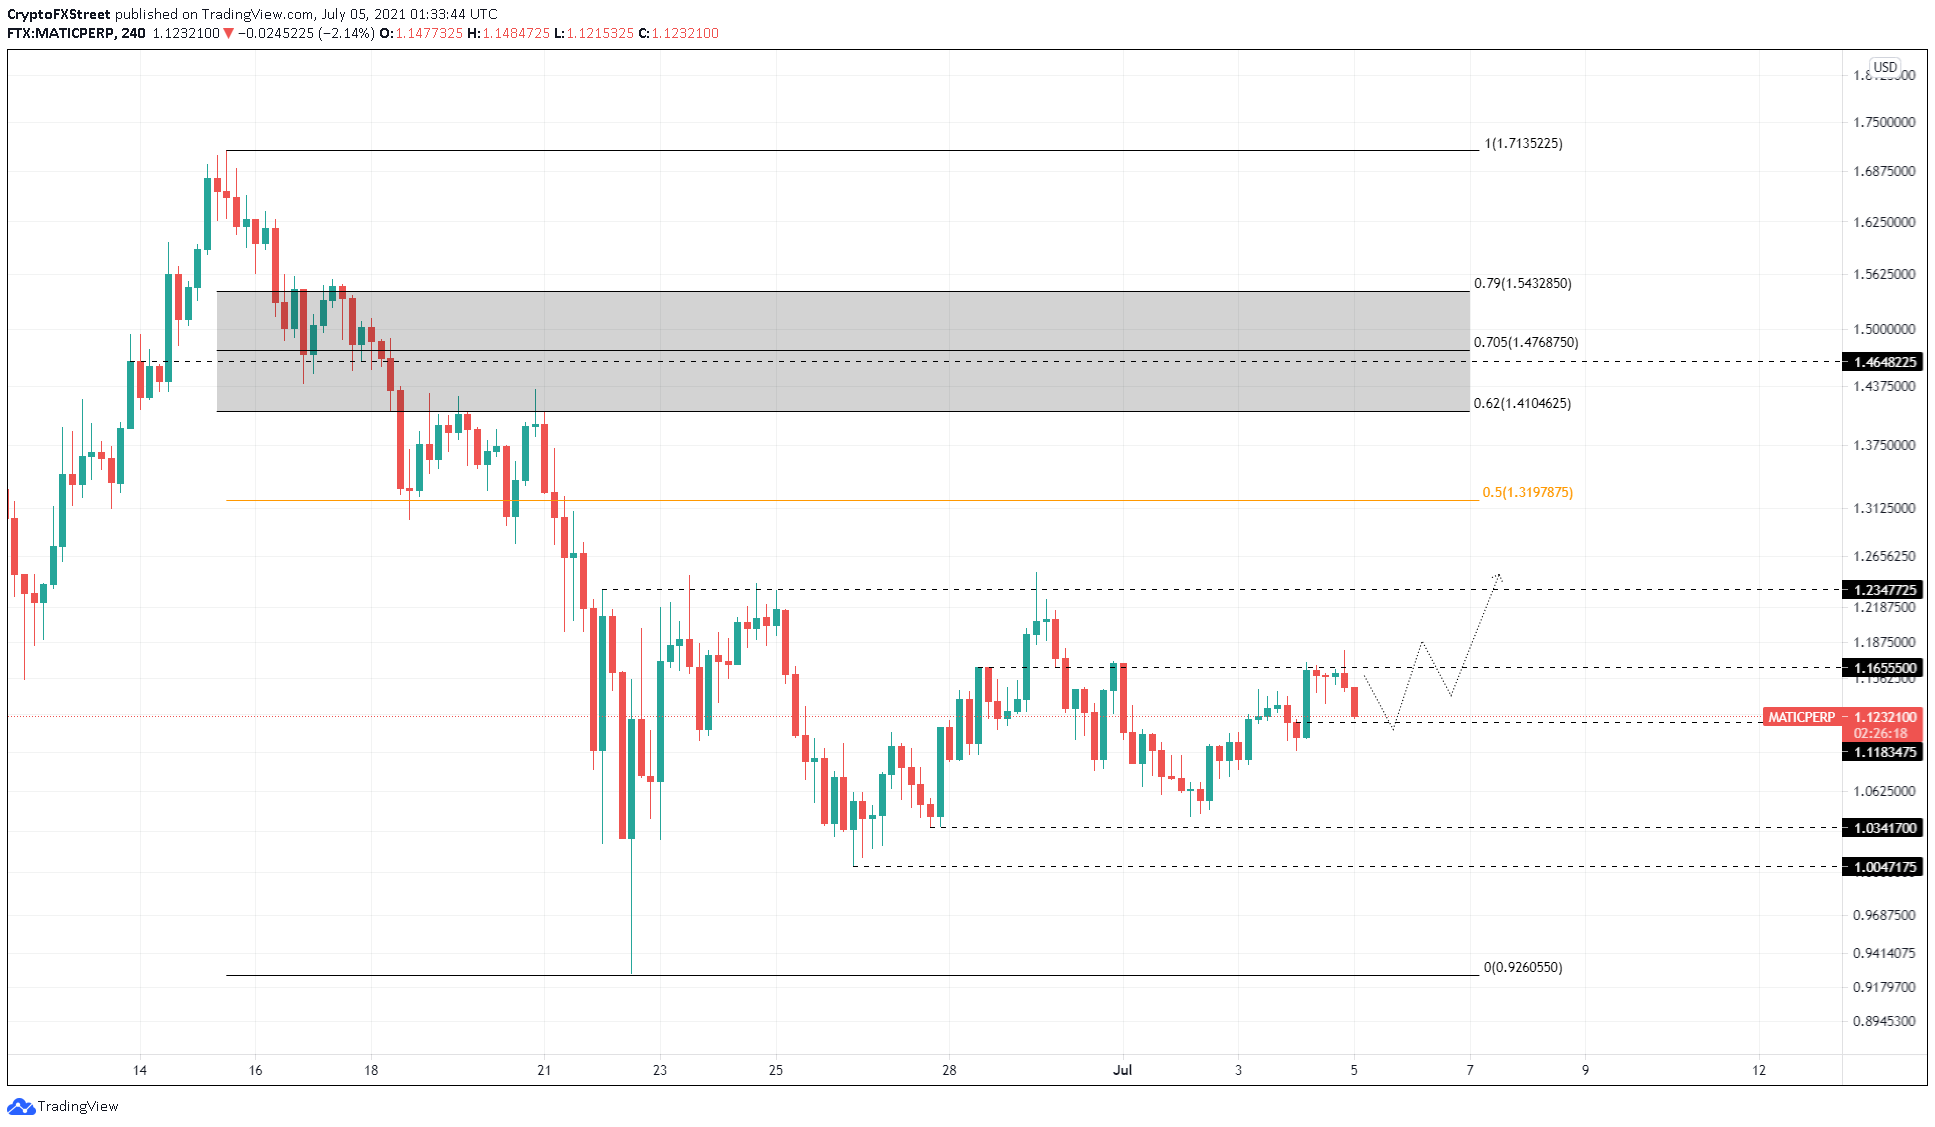
MATIC/USDT 4-hour chart
If the buyers continue to book profit, the immediate demand barrier at $1.183 might be breached. In such a case, the pullback could extend up to the subsequent support level at $1.034.
While the MATIC price might dip below $1.034 to sweep the lows, a failure to climb above will invalidate the bullish thesis. Such a move might trigger a retest of the support floor at $1.004.
Author

Akash Girimath
FXStreet
Akash Girimath is a Mechanical Engineer interested in the chaos of the financial markets. Trying to make sense of this convoluted yet fascinating space, he switched his engineering job to become a crypto reporter and analyst.


