MATIC Price Prediction: Polygon builds bullish momentum after teaming up with Infosys Consulting
- Polygon recently announced a partnership with Infosys Consulting.
- The collaboration, known as M-Setu, will help enterprises interoperate with the Ethereum blockchain.
- MATIC price presents a symmetrical triangle pattern, hinting at a 35% move.

Polygon has been on a tear in terms of developments and partnerships, but the MATIC price seems unresponsive.
Polygon partners with Infosys Consulting
Polygon, an L2 solution with scaling at its core, has seen massive adoption as of late. As a result, the project has seen a flurry of partnerships in the cryptocurrency ecosystem. The most recent and perhaps significant partner was Infosys Consulting, a consulting division of the Infosys parent company.
According to Polygon, the M-Setu collaboration is “an open-source bridge” for companies to inter-operate with the Ethereum blockchain.
To be specific, the insurance market will be the first target of this partnership. InsureChain will be the first application built on top of M-Setu to penetrate this area and showcase the ease of porting an insurance policy from one provider to another.
The announcement goes on to say,
Polygon is pleased to announce a new partnership with Infosys Consulting and showcase a proof-of-concept for the trillion-dollar insurance industry and explain how we can use this technology to address the use case of porting an insurance policy from one provider to the other.
This move marks Polygon’s official step in onboarding enterprises to the public blockchains.
MATIC price primed for next leg up
After surging nearly 3,500% during the previous bull run, the MATIC price is consolidating. This sideways move has produced a symmetrical triangle pattern obtained by connecting the three lower highs and two higher lows using trend lines.
While the setup has no inherent bias, a 35% breakout, determined by measuring the pivot high and low distance, seems likely. A close above the upper trend line at $0.382 will signal the start of a fresh uptrend.
Conversely, a dip below the lower boundary at $0.32 opens up the MATIC price for a further crash.
A potential spike in bullish pressure that invokes a close above the symmetrical triangle’s upper trend line at $0.38 will signal the start of an uptrend. However, a secondary confirmation will arrive after the buyers push the MATIC price beyond $0.40.
Investors need to beware that this ascent is not without challenges. The critical levels at $0.431 and $0.476 that serve as pit stops could deter the bullish momentum.
Clearing these barriers seals the MATIC price trajectory to $0.510.
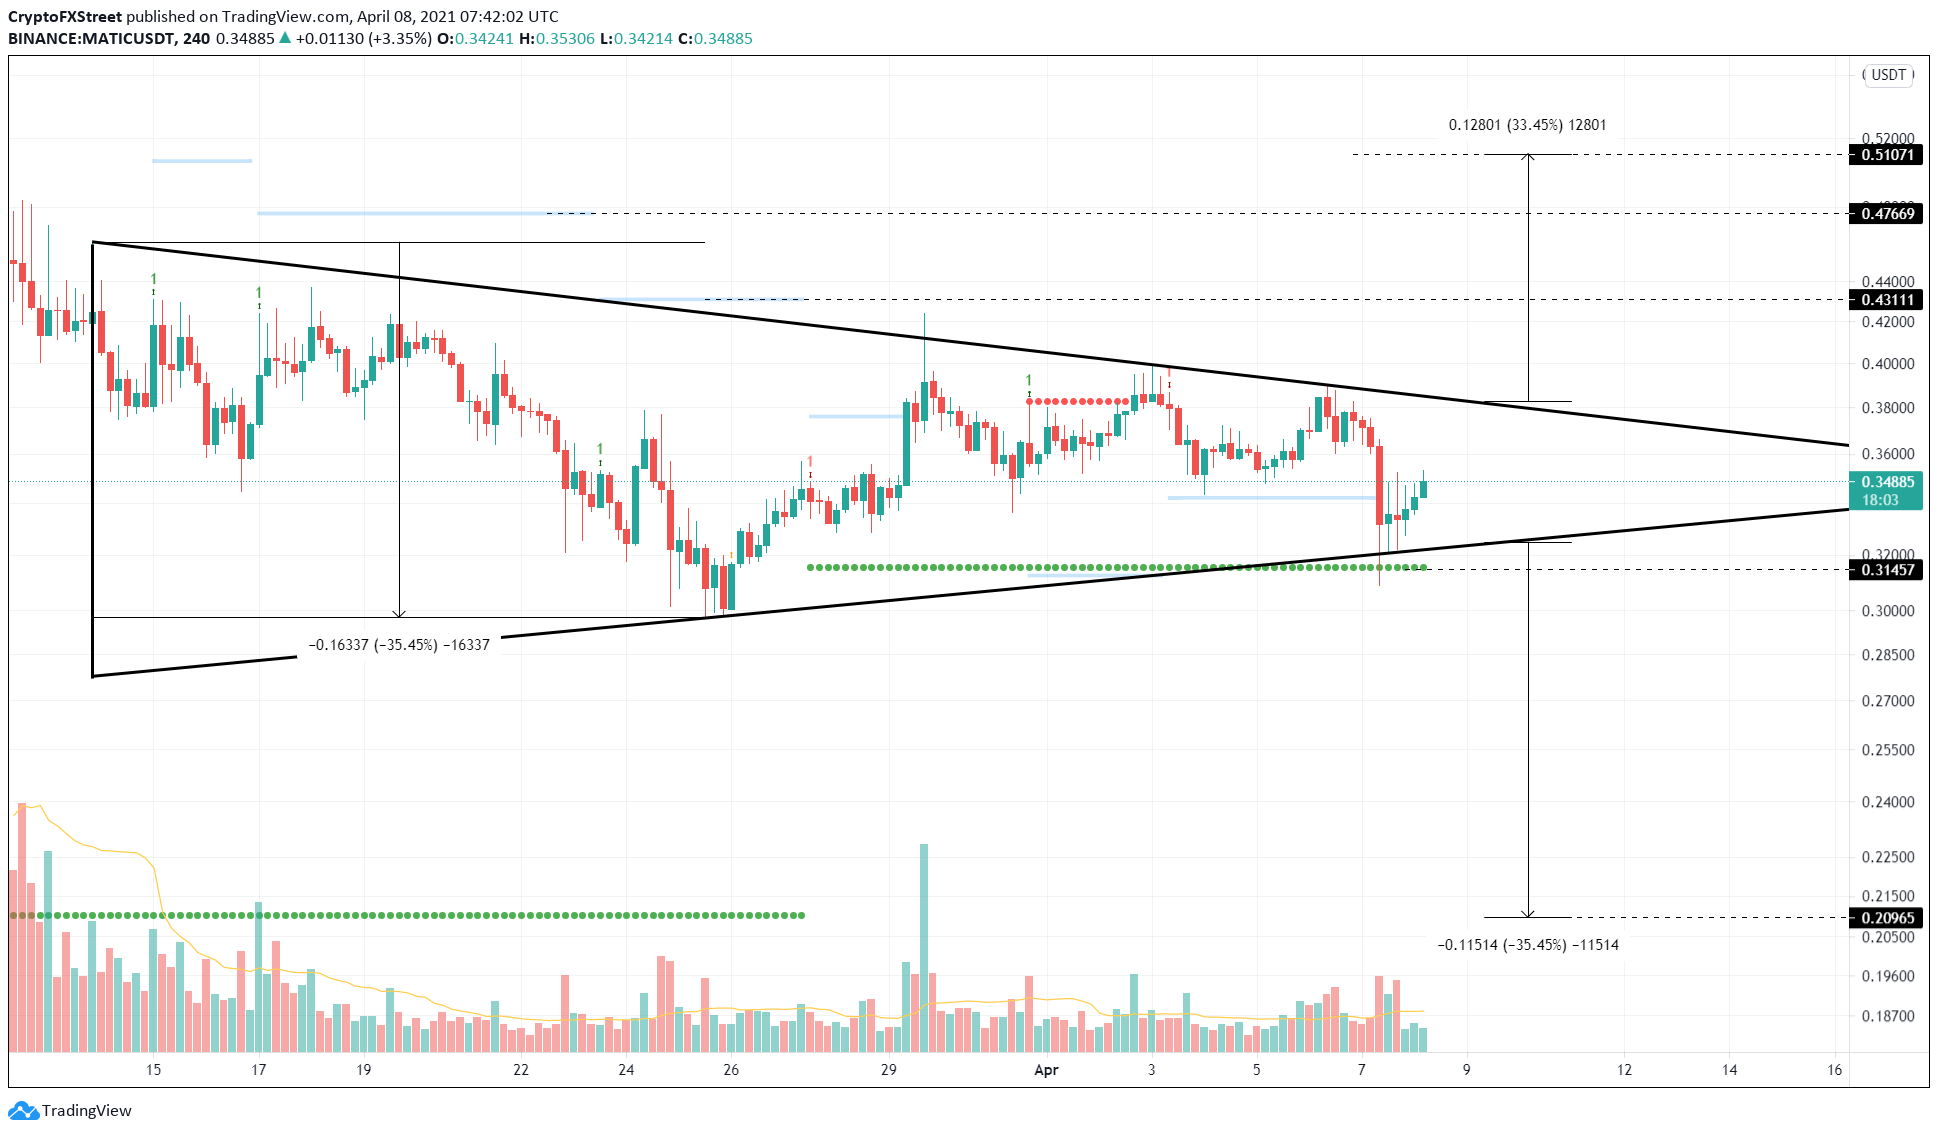
MATIC/USDT 4-hour chart
If the investors start booking profits leading to a breakdown of the symmetrical triangle’s lower boundary, it will trigger a new downtrend. However, the bullish scenario will not be invalidated until the MATIC price produces a decisive close below $0.291.
This move will create a lower low and hence serve as a reliable bearish confirmation. If this were to happen, market participants could expect the MATIC price to slide 7% lower to $0.273.
A breakdown of this level might extend this descent to $0.204.
Author

Akash Girimath
FXStreet
Akash Girimath is a Mechanical Engineer interested in the chaos of the financial markets. Trying to make sense of this convoluted yet fascinating space, he switched his engineering job to become a crypto reporter and analyst.