- MATIC price is likely to retrace to the $1.435 support level after failing to reclaim the $1.726 resistance barrier.
- The retracement will allow bulls to recuperate for a new leg-up to $1.892.
- On-chain metrics indicate a steady growth of new users, supporting the bullish thesis.
MATIC price is contemplating a retracement after it failed to conquer a resistance barrier. This downswing will serve as a break for the bulls, allowing the sidelined investors to jump on the bandwagon and kick-start a new leg-up.
MATIC price eyes higher high
MATIC price rallied 33% after it retraced to $1.272 on August 18. While this upswing was impressive, it failed to slice through the $1.726 resistance level, leading to a consolidation that will likely evolve into a retracement.
The $1.435 stable support barrier is likely to absorb the selling pressure, allowing for the start of a new uptrend.
Although unlikely, in some cases Polygon might form a double bottom around the August 18 swing low at $1.272. Investors can expect a new rally to begin at $1.435 or $1.272 in either case.
The resistance level at $1.726 will be the first barrier the bulls need to shatter to indicate a new rally’s start. Following a breach of $1.726, MATIC price will retest $1.892, a roughly 32% upswing from $1.435.
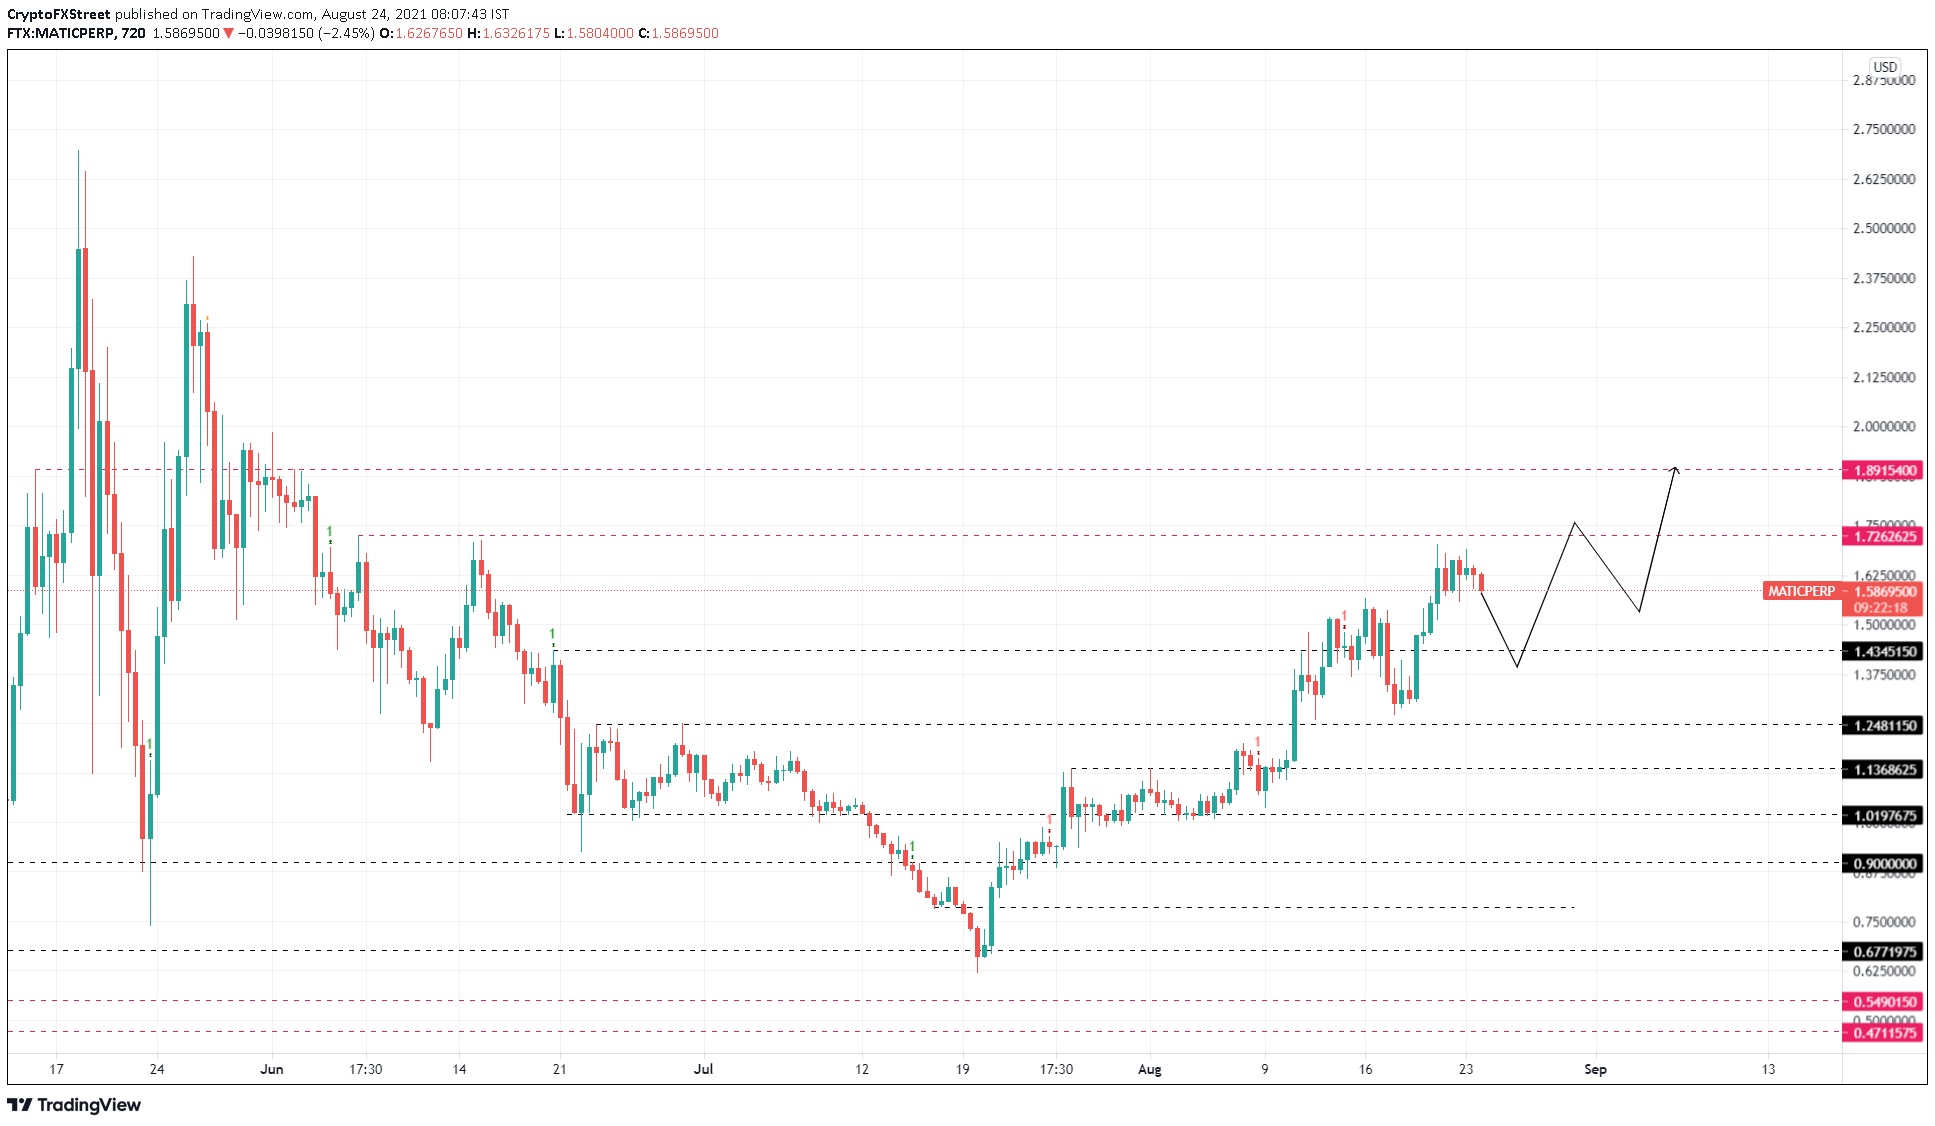
MATIC/USDT 12-hour chart
IntoTheBlock’s Global In/Out of the Money (GIOM) model shows that MATIC price could not cross a resistance cluster ranging from $1.54 to $1.69. Here, roughly 13,800 addresses purchased 54.89 million MATIC tokens.
The inability of the buyers to resolutely conquer this price territory seems to have caused this short-term retracement.
However, this index also shows that nearly 18,200 addresses purchased 130.5 million tokens at an average price of $1.47, which will serve as a strong support level for restarting an uptrend.
Interestingly, this level approximately coincides with the area mentioned above.
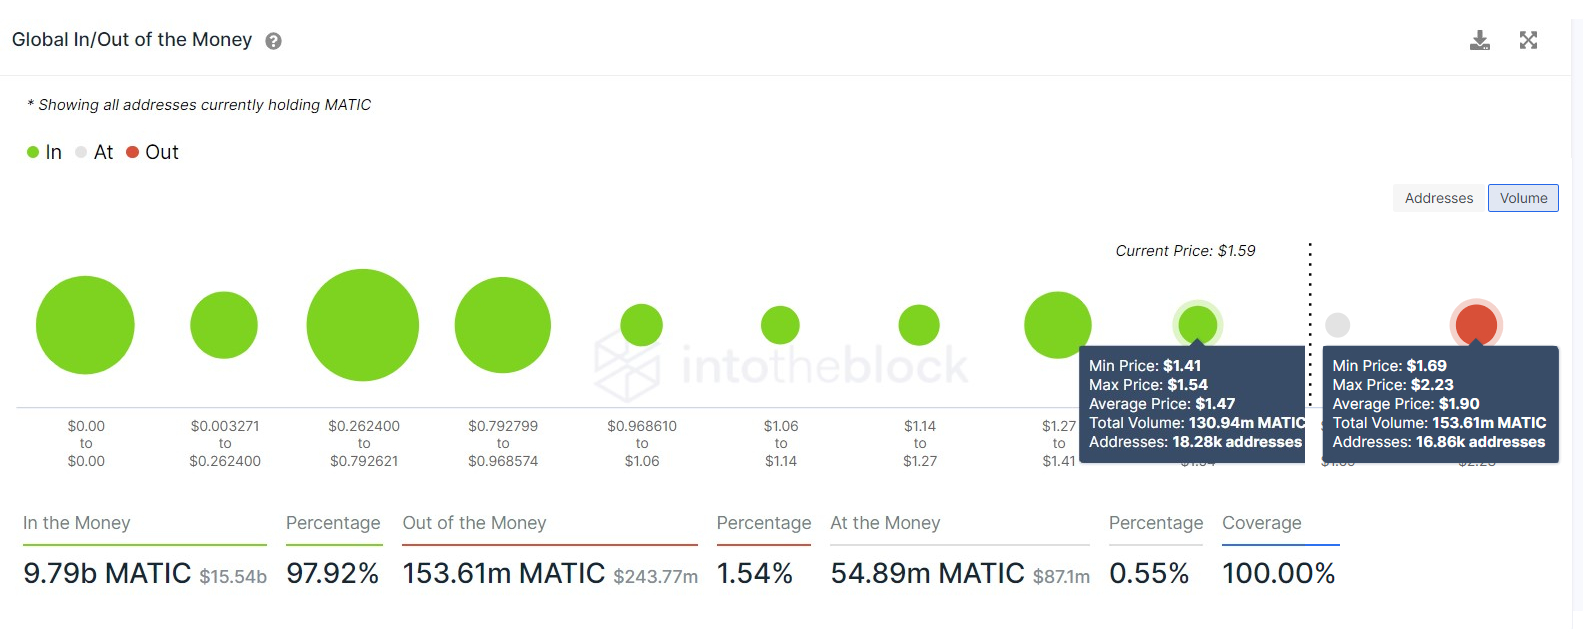
MATIC GIOM chart
While a retracement seems inevitable, new investors joining the Polygon network appear to be on an uptrend. Over the past month, the number of daily new addresses increased from 2,200 to nearly 3,000.
This 36% increase indicates that market participants are interested in MATIC at the current price levels, which serves as a proxy to the inflow of capital, which paints a bullish picture.
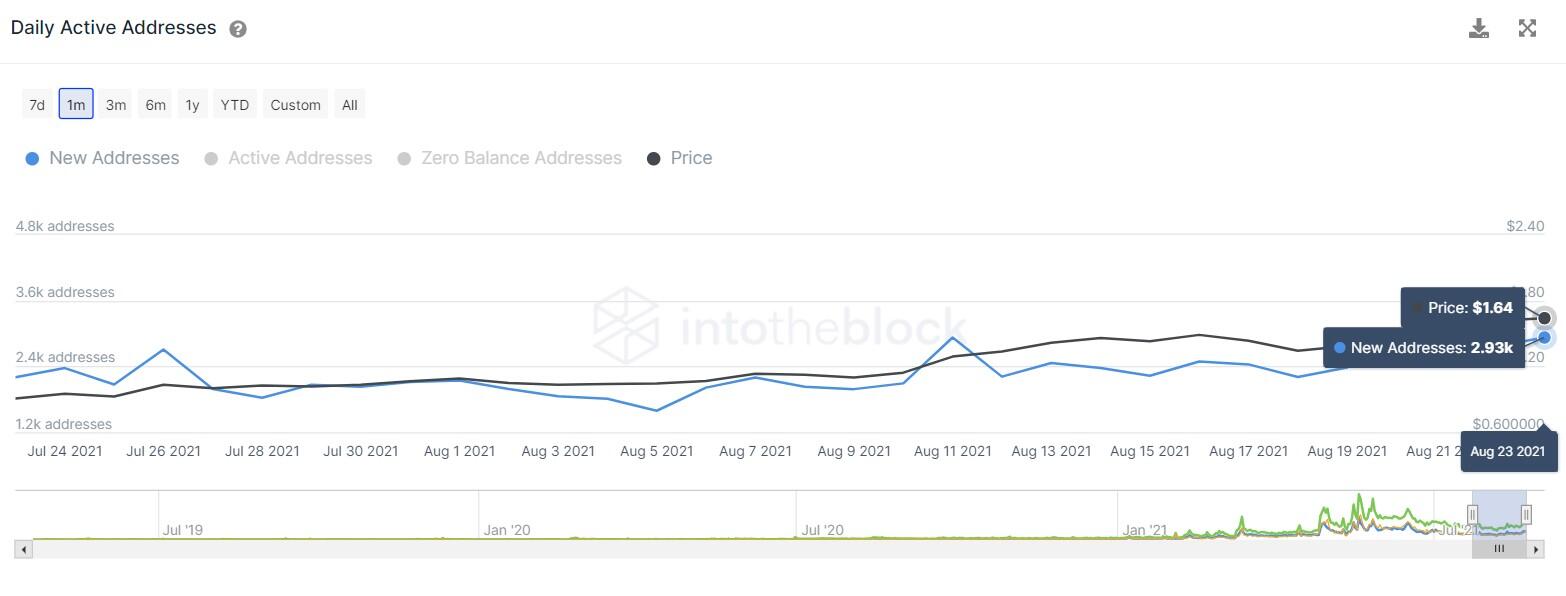
MATIC daily new addresses chart
While things seem to be looking up for MATIC price, a breakdown of $1.435 will indicate weakness among buyers. If the bulls fail to set up a base around the August 18 swing low at $1.272, the upswing will be in jeopardy.
However, a breakdown of the $1.248 support barrier will invalidate the bullish thesis entirely. This move will open the path for a further downswing to $1.136.
Information on these pages contains forward-looking statements that involve risks and uncertainties. Markets and instruments profiled on this page are for informational purposes only and should not in any way come across as a recommendation to buy or sell in these assets. You should do your own thorough research before making any investment decisions. FXStreet does not in any way guarantee that this information is free from mistakes, errors, or material misstatements. It also does not guarantee that this information is of a timely nature. Investing in Open Markets involves a great deal of risk, including the loss of all or a portion of your investment, as well as emotional distress. All risks, losses and costs associated with investing, including total loss of principal, are your responsibility. The views and opinions expressed in this article are those of the authors and do not necessarily reflect the official policy or position of FXStreet nor its advertisers. The author will not be held responsible for information that is found at the end of links posted on this page.
If not otherwise explicitly mentioned in the body of the article, at the time of writing, the author has no position in any stock mentioned in this article and no business relationship with any company mentioned. The author has not received compensation for writing this article, other than from FXStreet.
FXStreet and the author do not provide personalized recommendations. The author makes no representations as to the accuracy, completeness, or suitability of this information. FXStreet and the author will not be liable for any errors, omissions or any losses, injuries or damages arising from this information and its display or use. Errors and omissions excepted.
The author and FXStreet are not registered investment advisors and nothing in this article is intended to be investment advice.
Recommended Content
Editors’ Picks

Crypto fraud soars as high-risk addresses on Ethereum, TRON networks receive $278 billion
The cryptocurrency industry is growing across multiple facets, including tokenized real-world assets, futures and spot ETFs, stablecoins, Artificial Intelligence (AI), and its convergence with blockchain technology, as well as the dynamic decentralized finance (DeFi) sector.

Bitcoin eyes $100,000 amid Arizona Reserve plans, corporate demand, ETF inflows
Bitcoin price is stabilizing around $95,000 at the time of writing on Tuesday, and a breakout suggests a rally toward $100,000. The institutional and corporate demand supports a bullish thesis, as US spot ETFs recorded an inflow of $591.29 million on Monday, continuing the trend since April 17.

Meme coins to watch as Bitcoin price steadies
Bitcoin price hovers around $95,000, supported by continued spot BTC ETFs’ inflows. Trump Official is a key meme coin to watch ahead of a stakeholder dinner to be attended by President Donald Trump. Dogwifhat price is up 47% in April and looks set to post its first positive monthly returns this year.

Cardano Lace Wallet integrates Bitcoin, boosting cross-chain capabilities
Cardano co-founder Charles Hoskinson announced Monday that Bitcoin is integrated into the Lace Wallet, expanding Cardano’s ecosystem and cross-chain capabilities. This integration enables users to manage BTC alongside Cardano assets, providing support for multichain functionality.
Bitcoin Weekly Forecast: BTC consolidates after posting over 10% weekly surge
Bitcoin (BTC) price is consolidating around $94,000 at the time of writing on Friday, holding onto the recent 10% increase seen earlier this week.

The Best brokers to trade EUR/USD
SPONSORED Discover the top brokers for trading EUR/USD in 2025. Our list features brokers with competitive spreads, fast execution, and powerful platforms. Whether you're a beginner or an expert, find the right partner to navigate the dynamic Forex market.