MATIC price looks ready for a 15% gain as Polygon tags a crucial support level
- MATIC price has dropped 18% on January 5 and retested the 50-day Simple Moving Average (SMA) at $2.14.
- Investors can expect a 15% advance if Polygon bounces off this support level.
- A breakdown of the $2 demand barrier will invalidate the bullish thesis.

MATIC price seems to be running on fumes and is likely to see a relief bounce after the January 5 flash crash. The drop pushed Polygon to retest a crucial support level which could catalyze a minor uptrend.
MATIC price eyes a recovery rally
MATIC price dropped roughly 18% on January 5 and sliced through the 50-day SMA at $2.14. Although Polygon recovered above it, it is currently retesting this barrier in hopes of a relief bounce.
An increased buying pressure around $2.14 is likely, considering the overall bullish direction seen by MATIC price since July 19, 2021. Therefore, market participants can expect Polygon to rally 15% and retest the $2.47 resistance barrier.
This uptrend is highly situational and could see a further extension if the bid orders pile up. In such a case, MATIC price might revisit the $2.70 resistance barrier, bringing the entire journey to a 25% advance.
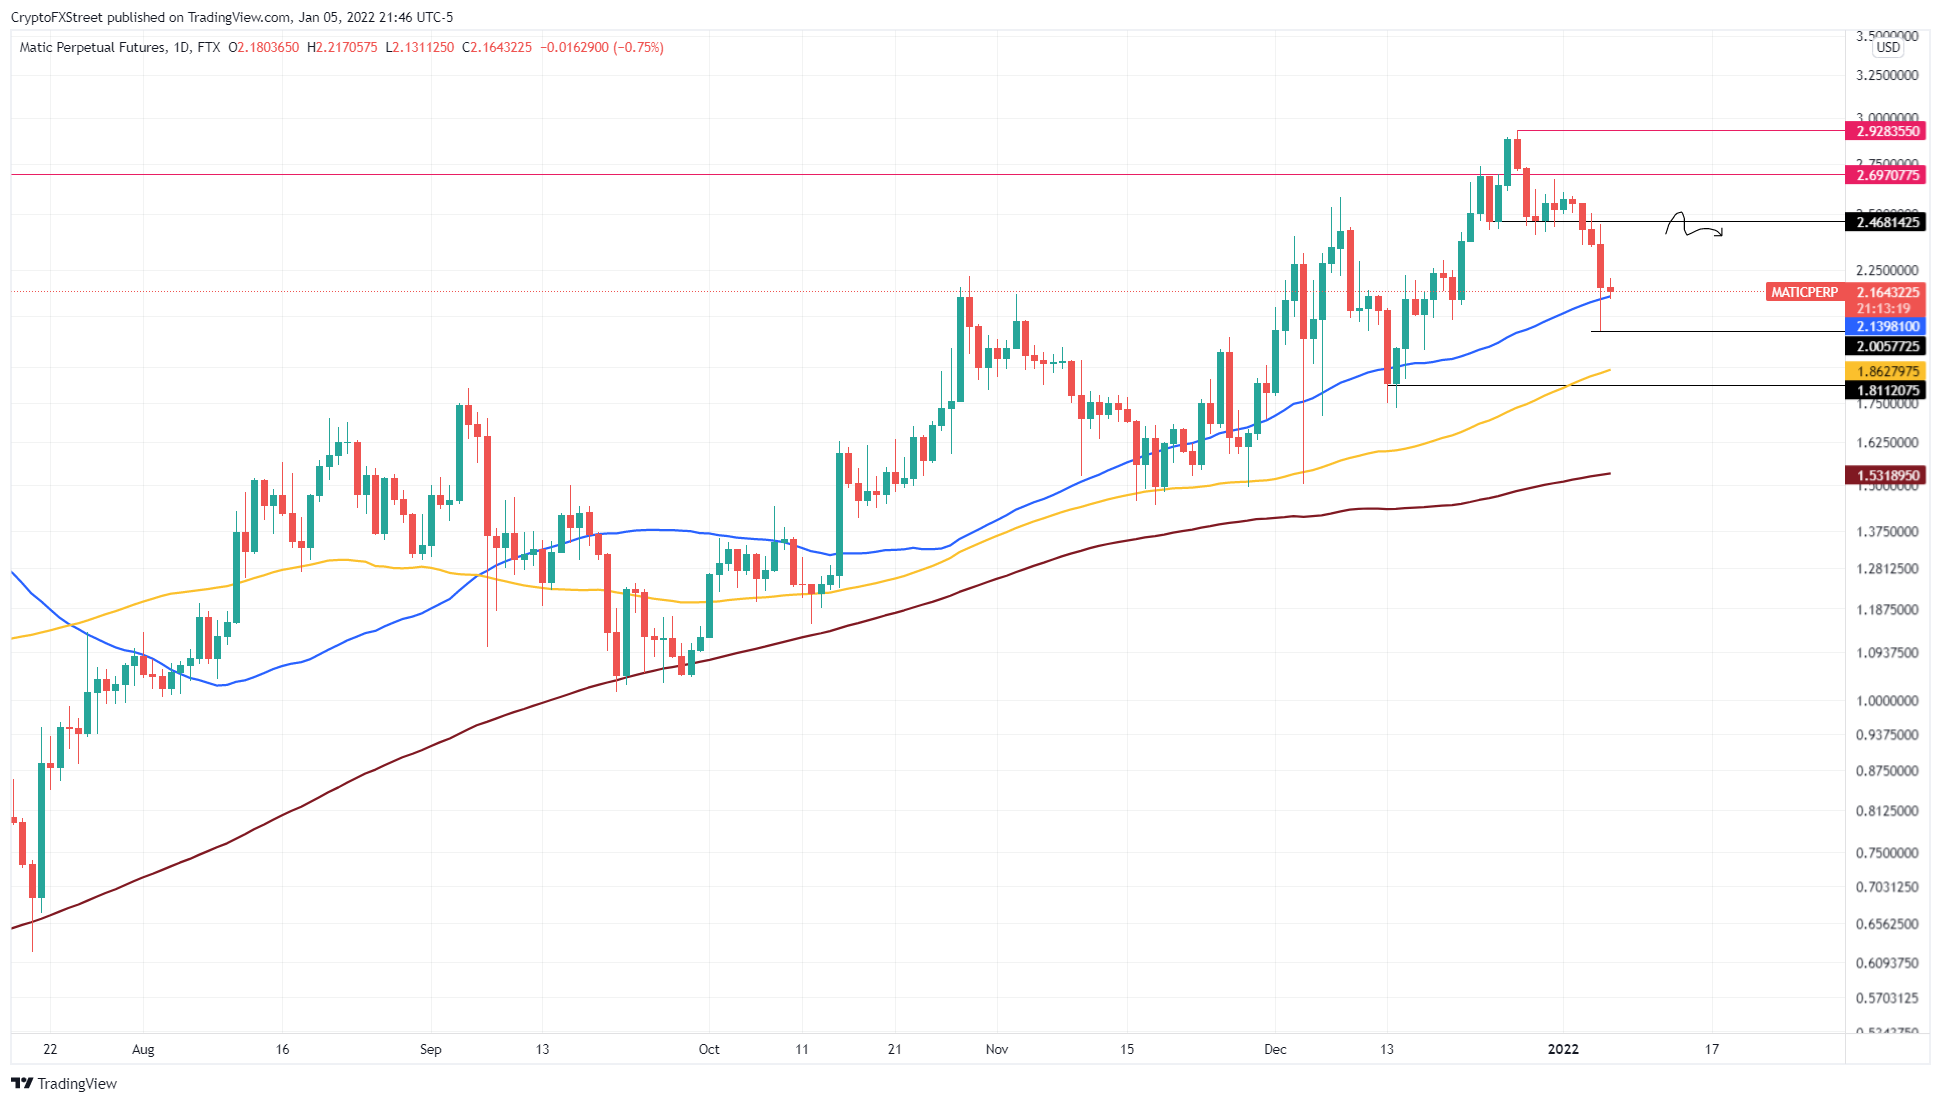
MATIC/USDT 1-day chart
On the other hand, if MATIC price produces a four-hour candlestick close below the 50-day SMA at $2.14, it will indicate an increased seller activity. This development will suggest that Polygon will revisit the $2 psychological level and, in some cases, the 100-day SMA at $1.86.
A breakdown of the $1.86 barrier will create a lower low, invalidating the bullish outlook. This move could trigger MATIC price to revisit the 200-day SMA at $1.53.
Author

Akash Girimath
FXStreet
Akash Girimath is a Mechanical Engineer interested in the chaos of the financial markets. Trying to make sense of this convoluted yet fascinating space, he switched his engineering job to become a crypto reporter and analyst.


