MATIC price goes cold, as Polygon financial metric offers an interesting twist
- MATIC price closed last week up 11.64%, leaving the digital token with a loss of -7.31% in July and a bullish hammer candlestick pattern on the monthly chart.
- Polygon 50-day simple moving average (SMA) and symmetrical triangle apex uniting to limit rally continuation.
- IntoTheBlock IOMAP metric highlights meaningful resistance (out of the money addresses) from $1.05 to $1.08.

MATIC price is up 47.66% since July 21, establishing one of the better rallies in the cryptocurrency complex over that time. The rally has placed Polygon at the junction of the symmetrical triangle’s apex with the 50-day SMA at $1.07. The ongoing consolidation is in time, not price, as the Bollinger Bands (BB) have contracted to the tightest reading in months, suggesting that MATIC price may be on the cusp of a substantial move to the upside.
MATIC price should deliver bullish outcomes to those who wait
The MATIC price rally on July 21 of 29% was a turning point for the longstanding correction from the May high of $2.89. It revealed the bullish intentions of institutional and prominent investors at the strategically important 200-day SMA.
Over the last eight sessions, Polygon has been correcting the rally from the 200-day SMA in time versus price, demonstrating the underlying bid for the cryptocurrency, despite the sizeable gain off the July 20 low. The result has been the narrowing of the BB(8) to levels last printed in March and April. Each instance preceded an important move. It is the type of relative strength that forecasts better returns moving forward.
To renew the rally, MATIC price needs to log a daily close above the rally high of July 26 at $1.17. If successful, Polygon is poised to reach the price congestion around $1.75, where the digital token struck support or resistance during June and May. A move of that magnitude would yield a 50% return from the July 26 high and a 72% gain from the current price.
A breakthrough above $1.75 will discover some resistance at $2.48 before pursuing the all-time high of $2.89, printed on May 19 and representing a 147% return from the July 26 high.
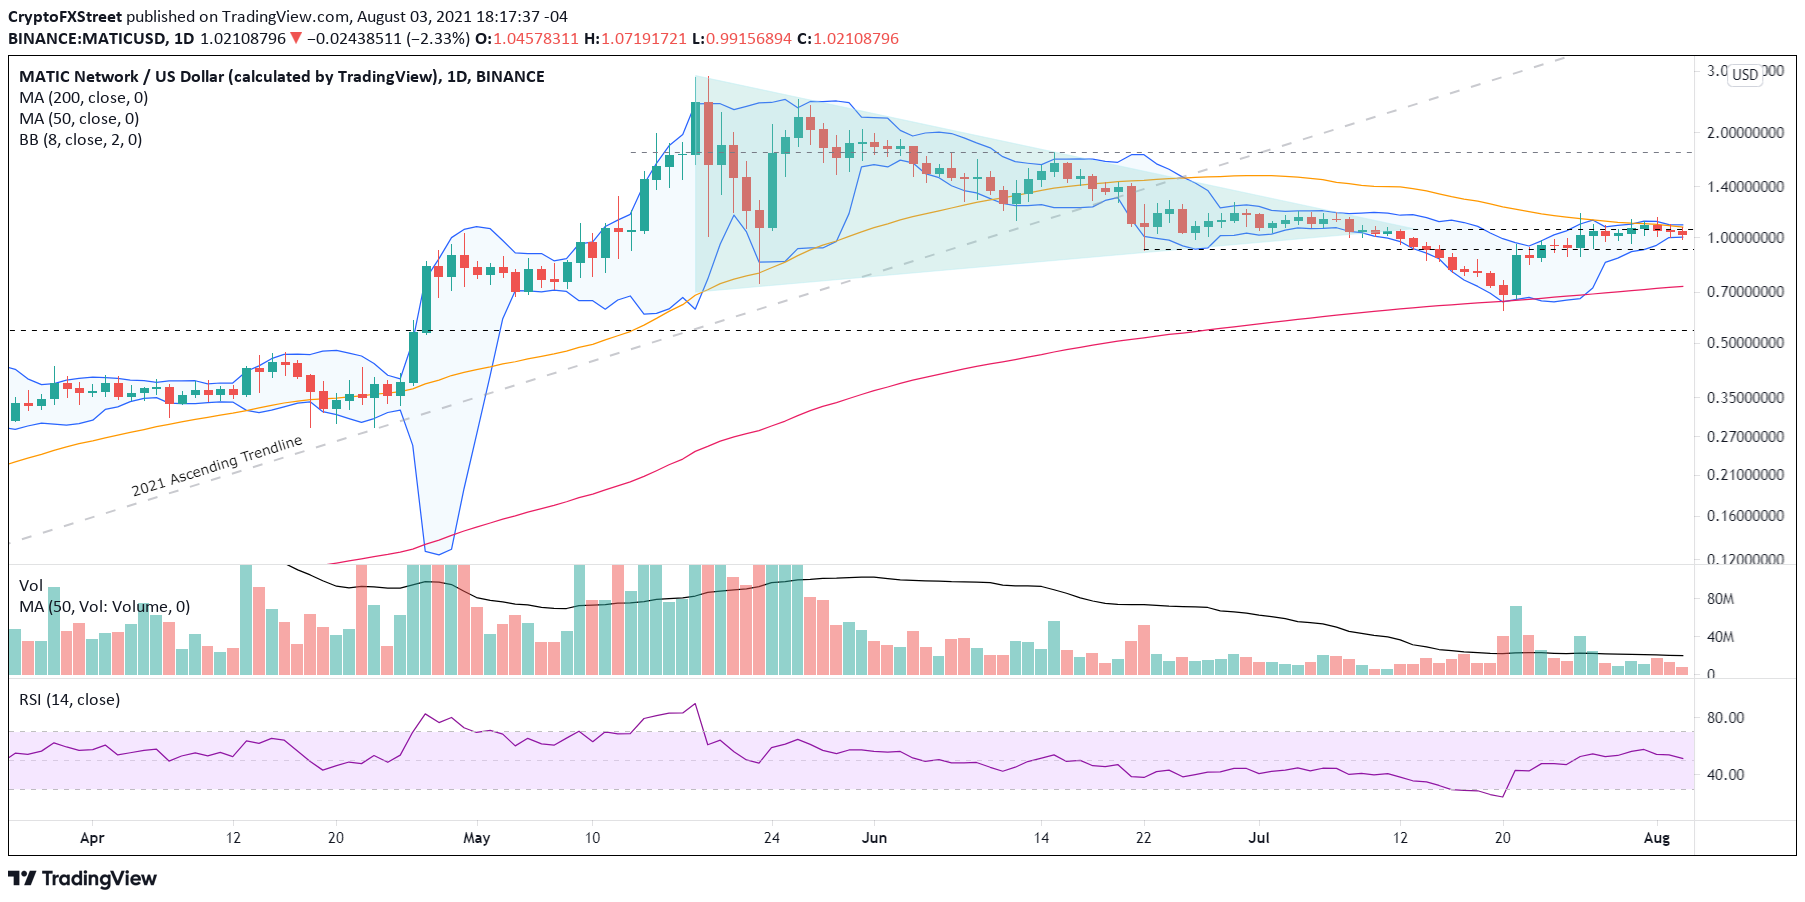
MATIC/USD daily chart
As been stated, the MATIC corrective process appears to be in time rather than price, but the June 22 low of $0.92 is critical support if selling pressure emerges. A close below the level may introduce a deeper correction and even a retest of the 200-day SMA at $0.51. If that scenario unfolds, it could imply that a more complex bottoming process is developing, or it may be a warning that Polygon is reaching for a new correction low. Either way, it will have voided the cryptocurrency’s legitimacy as a relative strength leader in the market.
The IntoTheBlock In/Out of the Money Around Price (IOMAP) metric does not support a bullish resolution of the ongoing consolidation, at least for now. According to the IOMAP, there is a large cluster of resistance (out of the money addresses) from $1.05 to $1.08, where 8.89k addresses own 129.39 million MATIC at an average price of $1.06. The range corresponds closely with the current price and the 50-day SMA at $1.07, possibly explaining the sideways price action over the last eight sessions. The resistance continues to $1.14 before MATIC price is freed to test higher prices.
Conversely, the downside should be contained to $0.98 to $1.02, where 3.72k addresses own 128.47 million MATIC at an average price of $1.00.
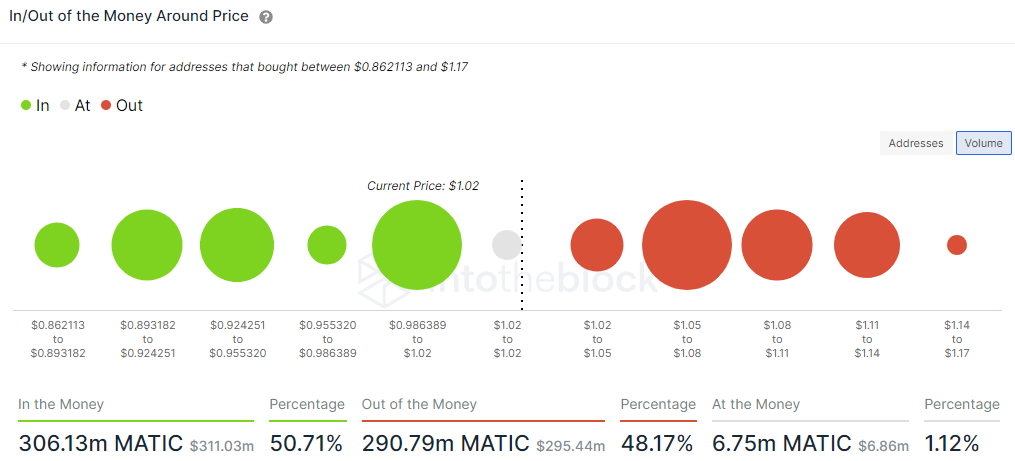
MATIC IOMAP - IntoTheBlock
In an interesting twist, the IOMAP metric appears to dispute the potential for MATIC price to resolve the consolidation to the upside but does not project a significant decline. Instead, it favors the status quo in the short term. Thus, Polygon investors need to practice patience, let the resistance around the 50-day SMA be slowly exhausted and then jump on the opportunity when there is a bullish resolution. Furthermore, the bullish hammer candlestick pattern on the monthly chart announces that the resolution could be quick and powerful.
Author

Sheldon McIntyre, CMT
Independent Analyst
Sheldon has 24 years of investment experience holding various positions in companies based in the United States and Chile. His core competencies include BRIC and G-10 equity markets, swing and position trading and technical analysis.


