MATIC price forms local bottom as Polygon kickstarts 10% upswing
- Polygon price action dips below $1.572 briefly in early morning trading.
- MATIC price refrains from further correction and could see bulls sitting on their hands to increase the price.
- Expect to see a bullish reversal once US equities kick in with further gains.

Polygon (MATIC) price action saw a not-so-pleasant rejection on bulls past Saturday as $1.75 proved to be too much defended by bears and pushed MATIC price back below the 200-day Simple Moving Average (SMA). As MATIC looks to heading for the second day of losses, the Relative Strenght Index (RSI) is showing a bullish divergence, with bulls and investors buying the correction. As this trading week kicks off, expect investors to start the week on a front footnote with Asian and European equities in the green.
MATIC will see traders on the front foot with a fresh view
Polygon price action was one of the cryptocurrencies that were a bit of an outlier last week, with price action going up where most cryptocurrencies were on the back foot. Unfortunately, the mood changed over the weekend as bulls got rejected from further upside potential at $1.75. The S1 monthly support a few cents below is now so chopped up it is not worth anymore as a reference in the trading plan.
Although MATIC price looks heavy this morning with a breach below $1.57, risk-on seems to be the theme in global markets. The RSI reflects an uptick towards 50, while MATIC price action is trading lower. This means bulls are buying, but it is not reflected in the price. Expect once bulls start to build up further, acceleration will be seen by an uptick in price action and could see back $1.75 today or tomorrow. Should this uptrend continue throughout the week, even $2.00 could be in the cards if risk-on is continuously omnipresent in the markets.
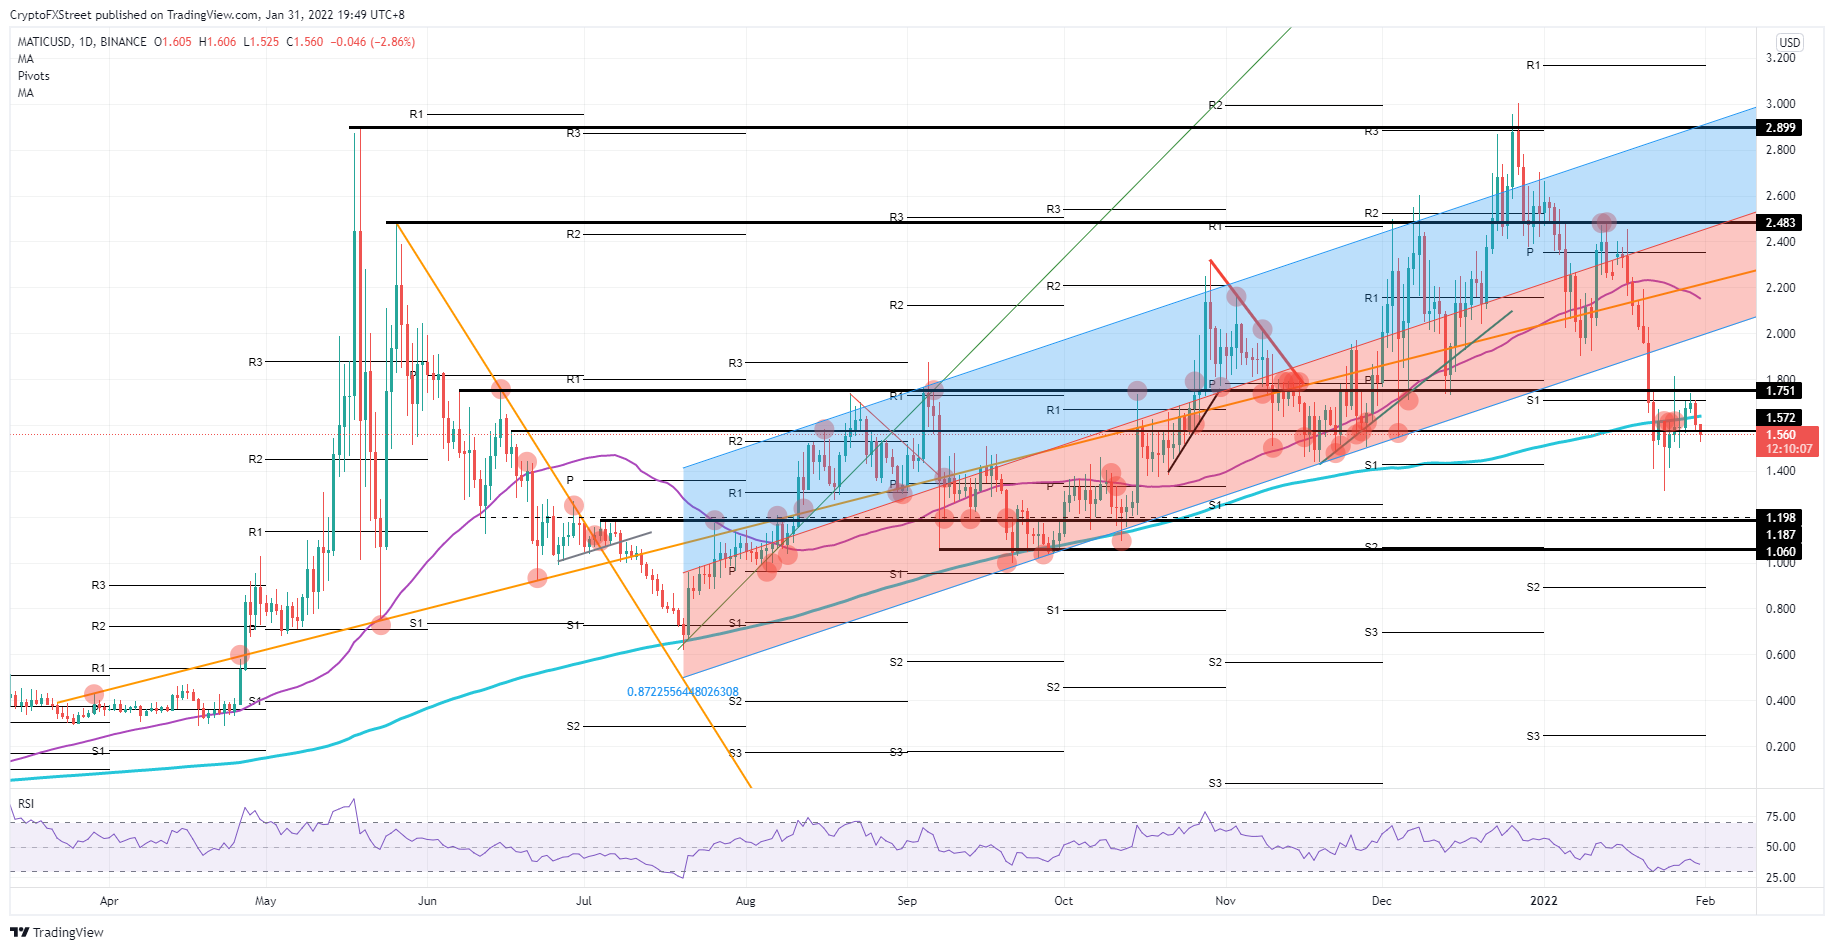
MATIC/USD daily chart
On the other hand, Polygon price action is so dependent on the risk mode in markets that another volatile week could see investors turn their backs towards cryptocurrencies for now. With that, the demand side would start to dry up and see MATIC price dip back towards $1.40, with $1.20 as a significant support level in the near term. Depending on the longevity of the correction, possibly $1.06 could be tested in the process before rebounding.
Author

Filip Lagaart
FXStreet
Filip Lagaart is a former sales/trader with over 15 years of financial markets expertise under its belt.


