MATIC Price Forecast: Polygon must crack critical resistance to claim new all-time highs
- MATIC price is trading inside an ascending parallel channel on the 4-hour chart.
- The digital asset must hold a vital support level for a chance to resume its uptrend.
- A potential breakout could see Polygon rise to nearly $3.

MATIC price has been trending upward for the past week, reaching a new all-time high of $1.89 on May 15. If the bullish momentum persists, Polygon may aim for $2.40 or even $2.90.
MATIC price targets higher highs
On the 4-hour chart, MATIC price seems to be forming a series of higher highs and higher lows. By connecting these pivot points using trendlines, an ascending parallel channel emerges.
Polygon is hovering around the channel’s middle trendline. Slicing through this resistance barrier could lead to an upswing towards the channel’s upper boundary at $2.40. But if the buying pressure is significant enough, MATIC price could break out of this consolidation pattern and advance another 26% toward $2.90.
This target is calculated by using the channel’s width added upward from the upper trendline.
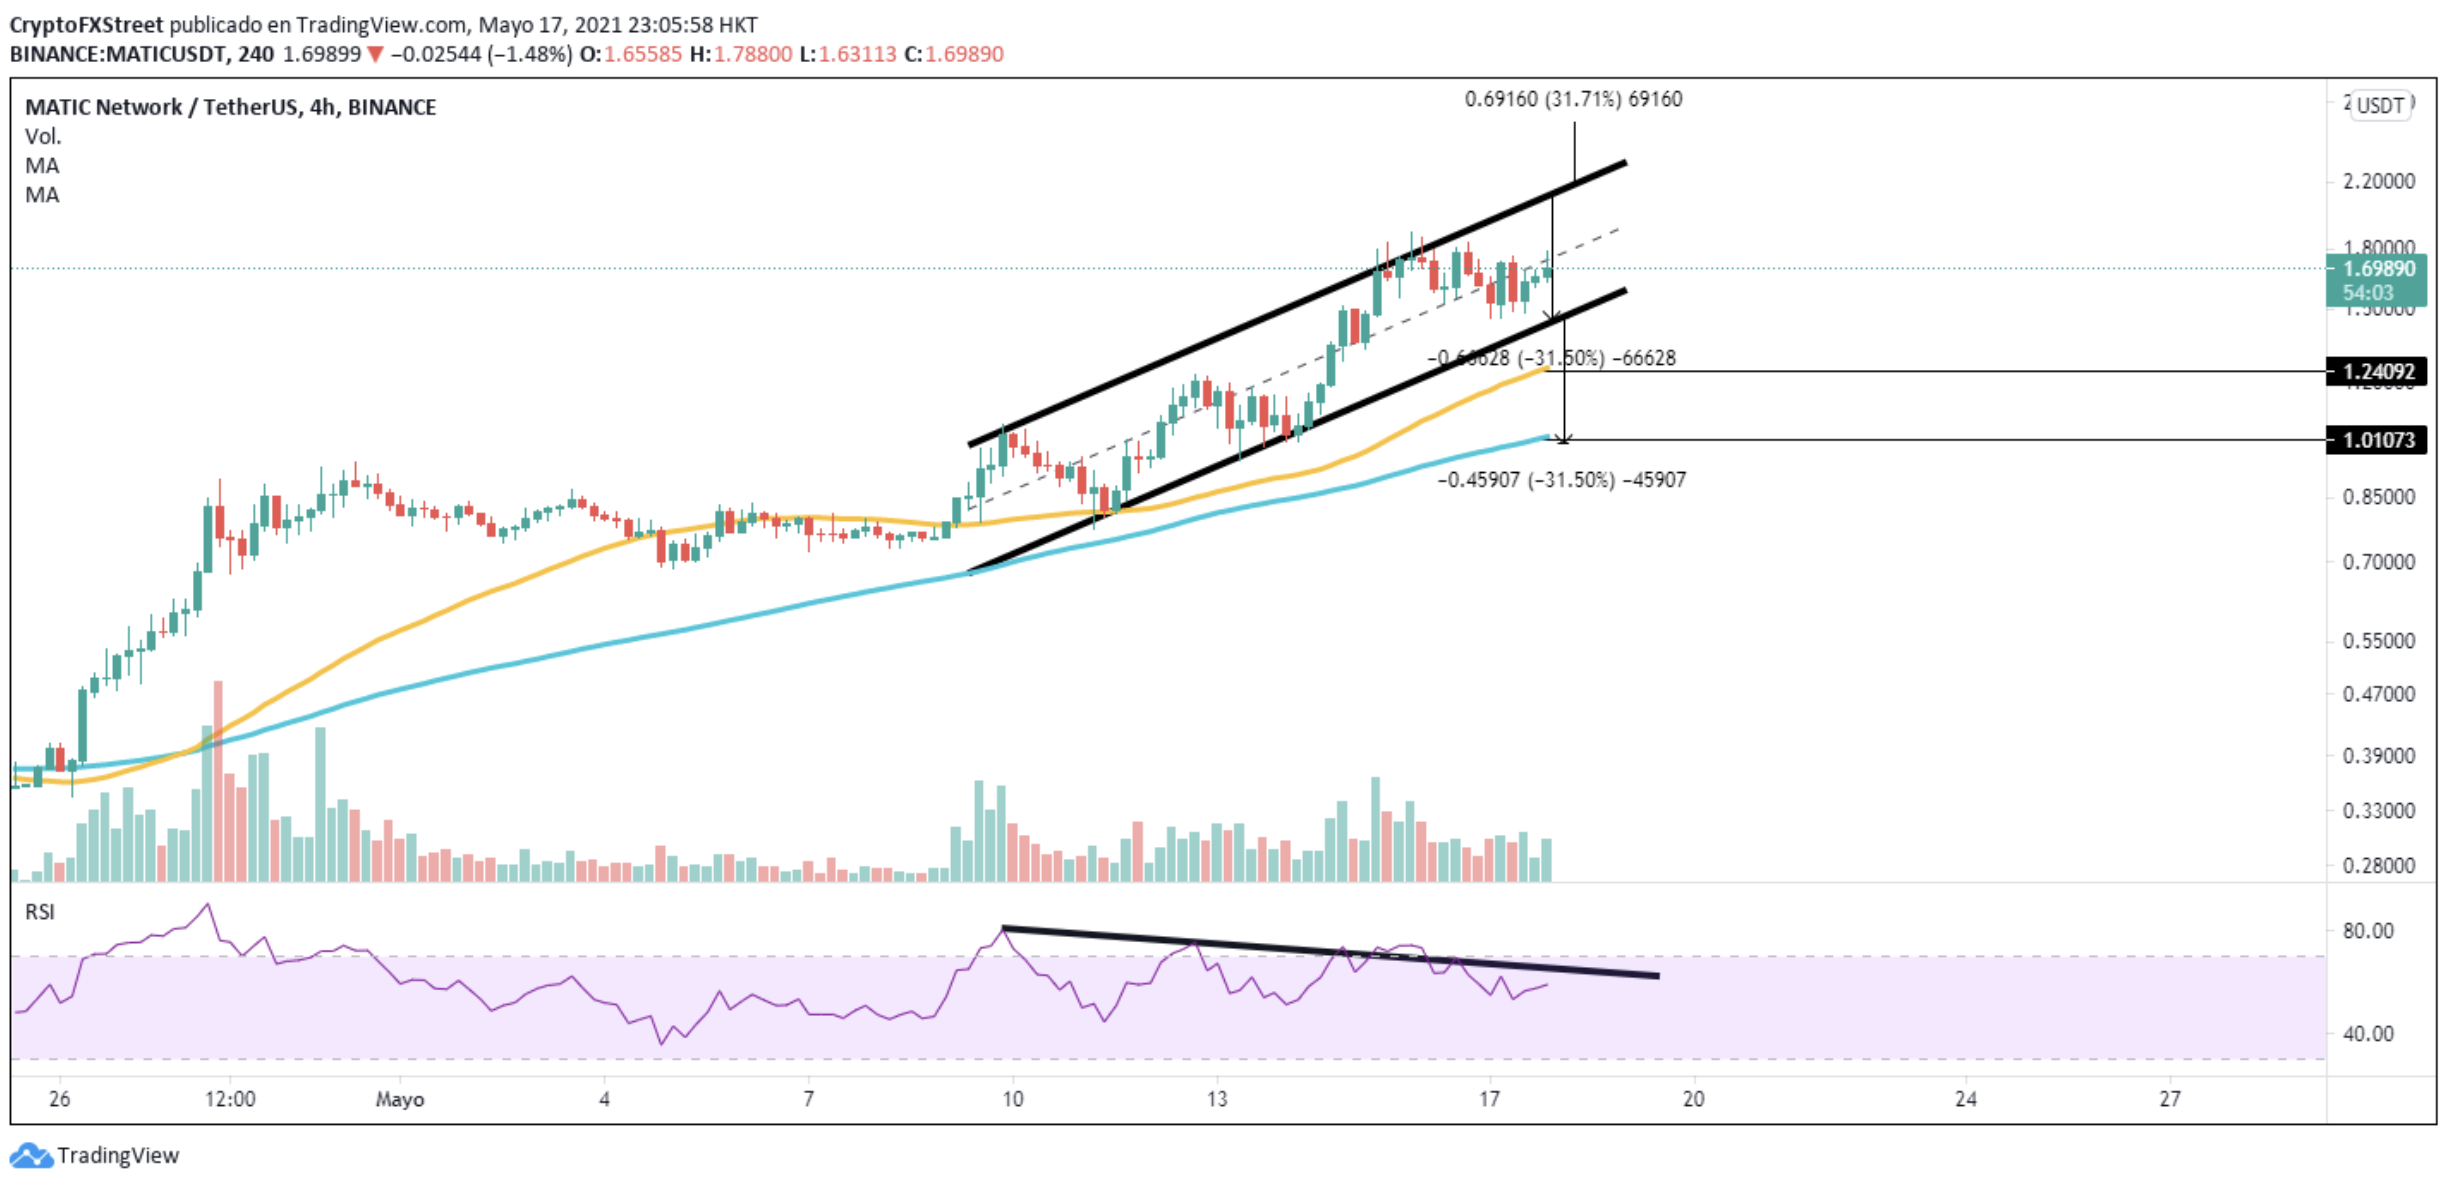
MATIC/USDt 4-hour chart
Investors must be aware of the bearish divergence between MATIC price and the relative strength index (RSI) indicator on the 4-hour chart, which suggests investors are interested in collecting profits.
A spike in profit-taking that leads to a breakdown below the channel’s lower trendline can push MATIC price toward the 50 four-hour MA at $1.24. If this support level fails to hold, then a steeper correction to the 100 four-hour MA at $1.00 can be expected.
Author

FXStreet Team
FXStreet


