MATIC Price Forecast: Polygon awaits 40% breakout
- MATIC price is consolidating inside a symmetrical triangle pattern awaiting a breakout.
- A decisive close above either of the trend lines results in a 40% move.
- Transactional data shows stacked barriers that could deter Polygon’s upswing.

The MATIC price is in a consolidation pattern with no inherent bias. Hence a breakout from this phase could push the token’s price in either direction.
MATIC price awaits a breakout
The MATIC price slid into consolidation, creating lower highs and higher lows due to aggressive yet diminishing pressure from both buyers and sellers. By connecting the swing highs and lows using trend lines, a symmetrical triangle pattern forms.
This technical formation forecasts a 40% breakout, which is the distance between the swing high and low created on March 11 and 12.
Since this setup has no bias, a decisive close above $0.38 will result in a 40% bull run to $0.54. On the other hand, a breakdown of the lower trend line at $0.31 will kickstart a downward trend to $0.19.
An increased seller activity at the current price will quickly push Polygon toward the lower trend line. However, a breakout here will spell trouble for the MATIC price. A 13% drop to the immediate demand barrier at $0.27 coinciding with the 200 SMA on the 6-hour chart seems likely.
If this level is pierced by overwhelming selling pressure, Polygon could indeed slide 30% to tap the intended target at $0.19.
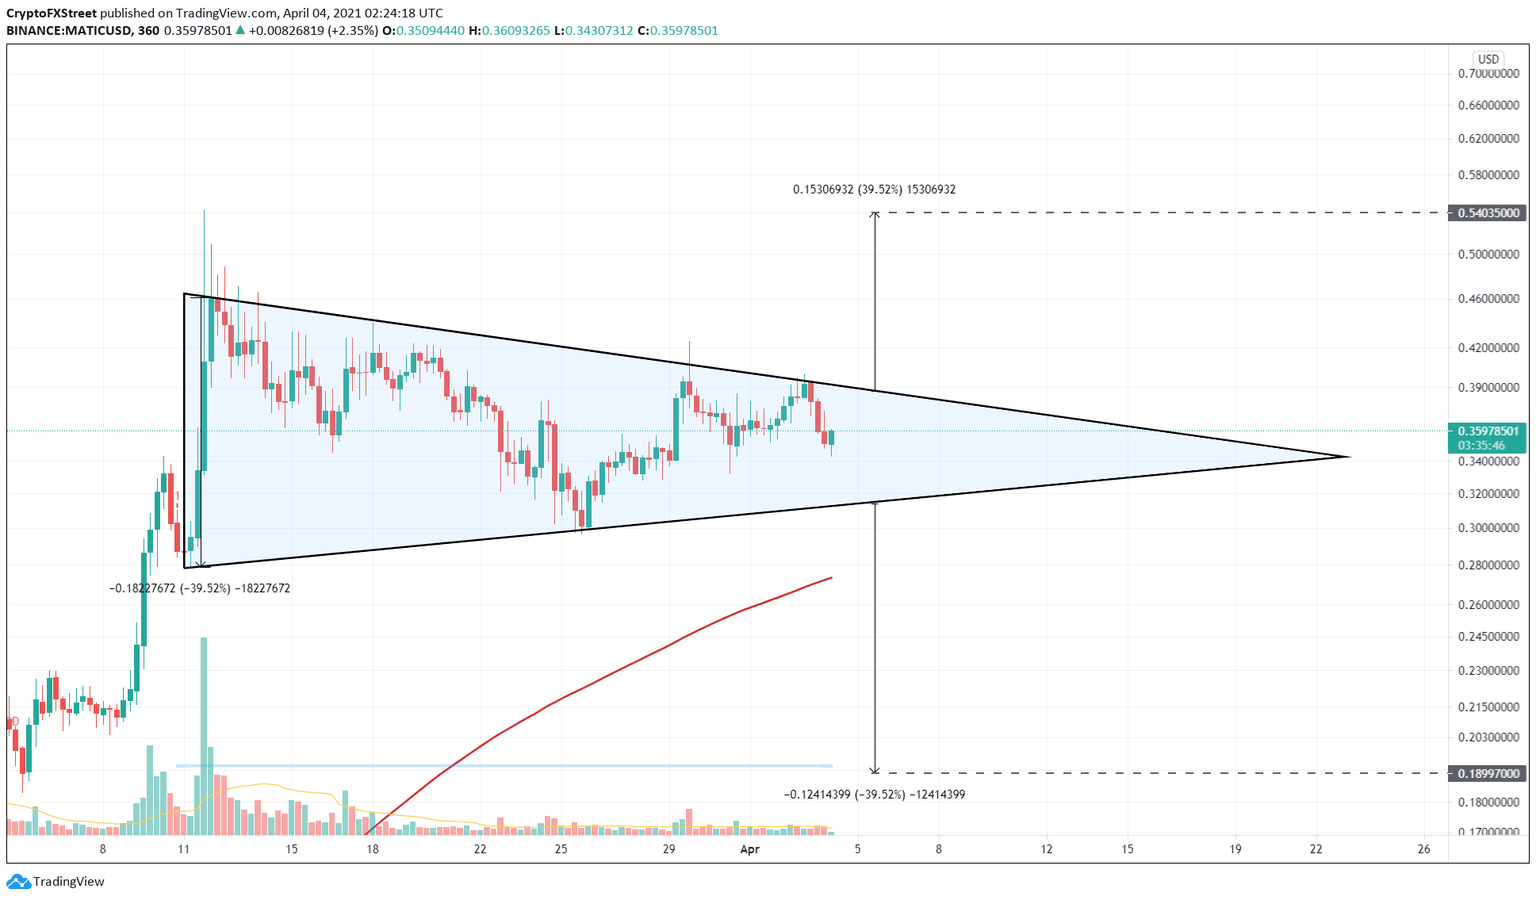
MATIC/USD 6-hour chart
Adding credence to the bearish outlook is a slew of underwater investors, as seen in IntoTheBlock’s In/Out of the Money Around Price (IOMAP) model. IOMAP reveals that 13,200 addresses that hold nearly 800 million MATIC tokens are “Out of the Money” and might break even, dampening the bullish momentum.
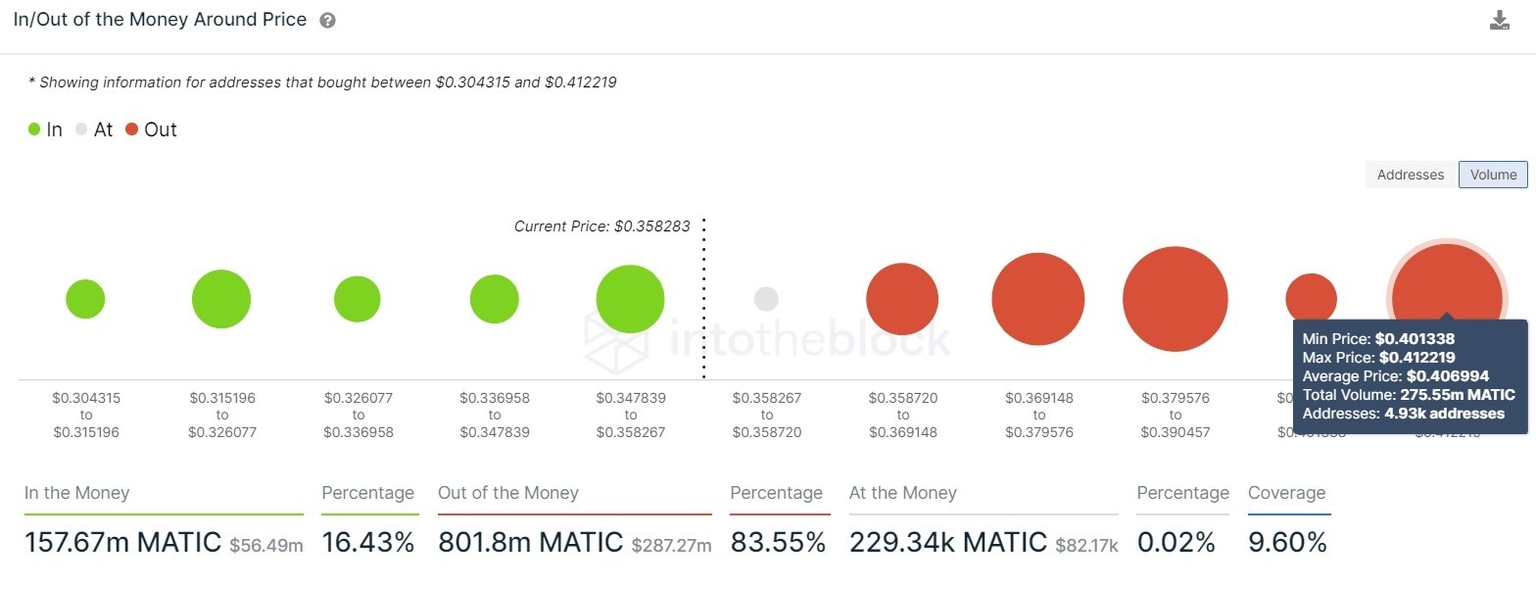
MATIC IOMAP chart
Additionally, the number of whales holding between 100,000 to 1,000,000 MATIC tokens has reduced by 8.5%, from 979 to 118. Following a similar trend are the investors that hold 1,000,000 to 10,000,000 MATIC tokens. These market participants have cut down their exposure to MATIC tokens by 13.5% since March 11.
Such a drastic reduction suggests that the whales aren’t optimistic about the MATIC price’s bullish potential.
%2520%5B08.11.40%2C%252004%2520Apr%2C%25202021%5D-637531009103662580.png&w=1536&q=95)
MATIC whale holder distribution chart
While the downward breakout seems set in stone, it could be altered by a strong surge in buyers or new capital flowing into the MATIC markets. If this momentum manages to push the price past the $0.40 supply barrier and create a higher high around $0.45, it will invalidate the bearish outlook.
In fact, such a move might catalyze a run-up to $0.54.
Author

Akash Girimath
FXStreet
Akash Girimath is a Mechanical Engineer interested in the chaos of the financial markets. Trying to make sense of this convoluted yet fascinating space, he switched his engineering job to become a crypto reporter and analyst.


