MATIC price downtrend to extend by 10% as Polygon searches for a support level
- MATIC price triggered a 22% downswing after piercing the bearish breaker, extending from $1.75 to $2.15.
- The resulting downswing will extend by another 10% to $1.44 before Polygon re-establishes a directional bias.
- A daily candlestick close above $2.15 will invalidate the bearish thesis.

MATIC price has been on a downtrend since December 27, 2021, and has shown no signs of a reversal so far. The recent uptrend, albeit promising for a while, failed to set up a higher high, resulting in a downswing. Going forward, investors can expect Polygon to drop lower before finding a stable support
MATIC price in search of a foothold
MATIC price action between December 8, 2021, and January 21 created a bearish breaker that extends from $1.75 to $2.15. This technical formation contains a higher high and broken demand zone, flipped into a breaker. A retest of this barrier often results in a severe rejection.
The 41% upswing that MATIC price experienced between February 3 and 7 pierced the said breaker but failed to shatter it. As a result, Polygon has dropped roughly 22% and is currently in search of a support level.
Therefore, investors can expect MATIC price to extend its descent by another 10% before encountering a strong $1.44 barrier. Market participants can expect Polygon to form a base around this barrier and take a U-turn.
In some cases, the altcoin might break below this foothold and make its way toward the next support level at $1.23. If the selling pressure continues to increase, the weekly support at $1.04 will be where a base forms.
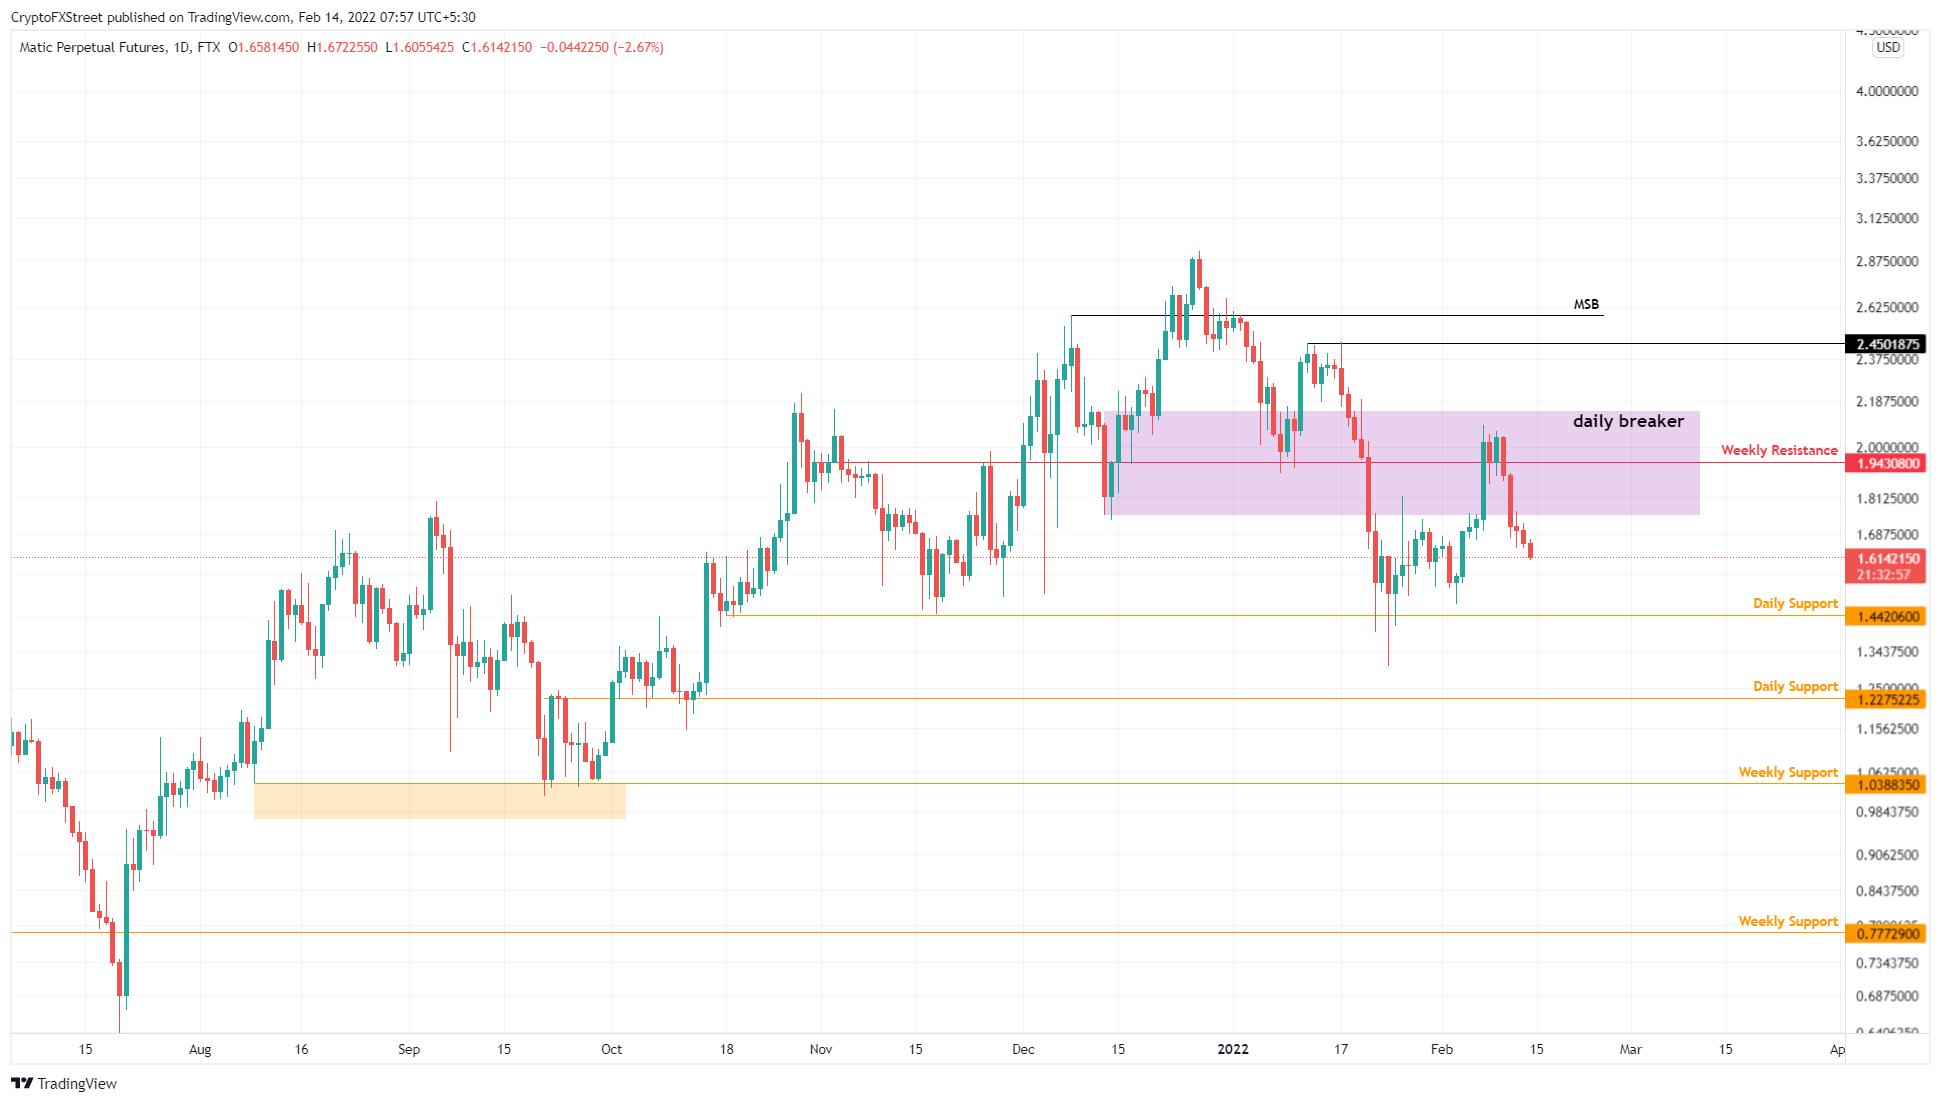
MATIC/USDT 1-day chart
On the other hand, if MATIC price produces a daily candlestick close above the breaker’s upper limit at $2.15, it will create a higher and invalidate the bearish thesis. In such a case, Polygon can revisit the $2.45 hurdle and re-establish a bullish outlook.
Author

Akash Girimath
FXStreet
Akash Girimath is a Mechanical Engineer interested in the chaos of the financial markets. Trying to make sense of this convoluted yet fascinating space, he switched his engineering job to become a crypto reporter and analyst.


