MATIC price could retest $1 as Polygon breaches a year old support
- MATIC price has flipped the 200-day SMA at $1.62 into a resistance barrier.
- The downswing could extend to $1 to collect the sell-side liquidity resting below it.
- A daily candlestick close above $2.14 will invalidate the bearish thesis for Polygon.

MATIC price has sliced through a crucial support area, flipping it into a resistance barrier. As Polygon trades around a familiar foothold, there is a chance market makers might drag the altcoin lower in hopes of collecting liquidity.
MATIC price faces a decisive moment
MATIC price has dropped 25% over the past three days and is likely to continue this descent. Perhaps, the main reason for this bearishness is the recent breach below the 200-day Simple Moving Average (SMA) at $1.62 after hovering above it for more than a year. Hence, this flip puts a bearish spin on Polygon.
Although Polygon tried to reach above this barrier, it failed and has dropped 6.6% today. However, unlike other altcoins, the downtrend for MATIC price could be cut short due to the daily support levels at $1.44 and $1.22.
While this outlook might seem slightly bullish, it is uncertain as market makers could knock MATIC price to tag the weekly support level at $1.03 in hopes of collecting the sell-stop liquidity resting below it.
Therefore, market participants should be prepared for a worst-case scenario, which is a 30% crash to $1 or lower.
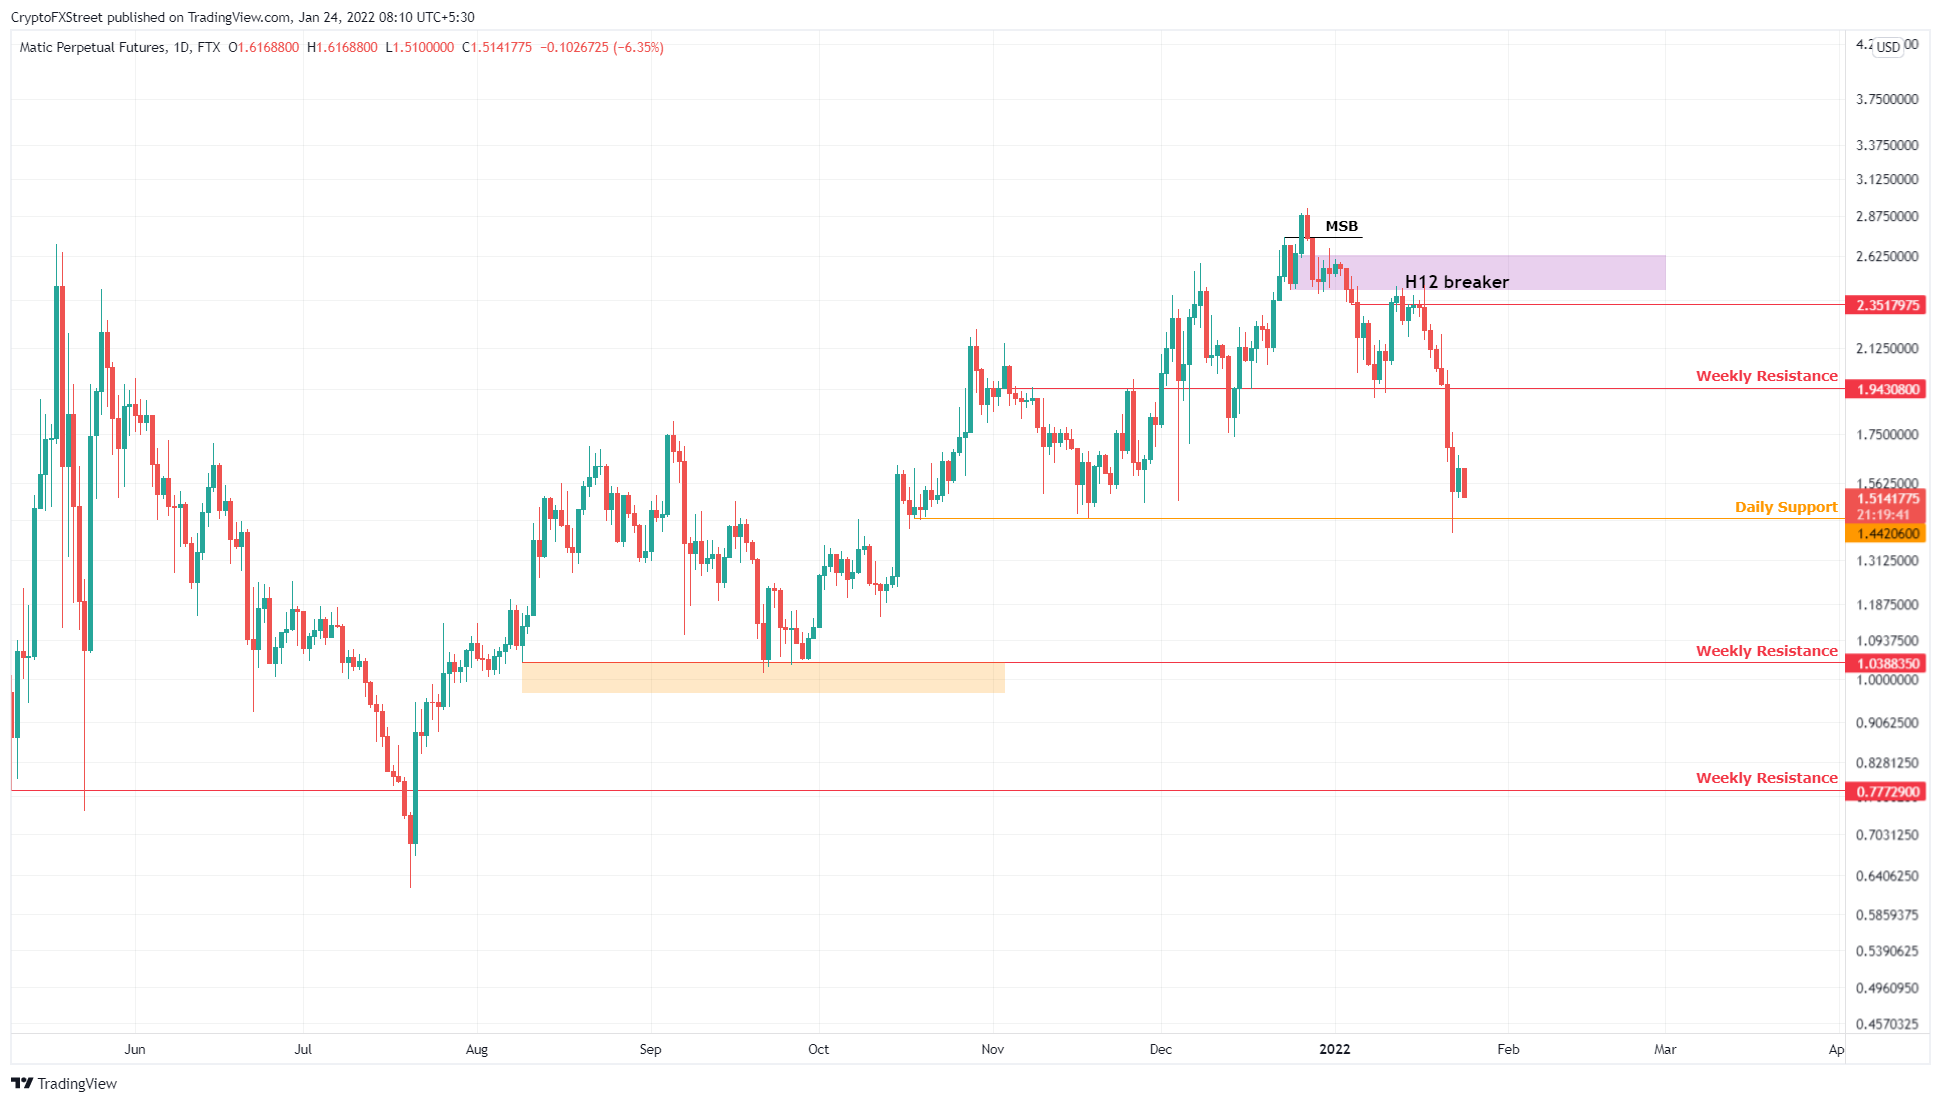
MATIC/USDT 1-day chart
Supporting this bearish outlook for MATIC price is IntoTheBlock’s Global In/Out of the Money (GIOM) model. This on-chain index shows that the stable support levels for Polygon after $1.44 are present at $1.22 and $0.99, where roughly 67,320 addresses purchased nearly 362 million MATIC tokens.
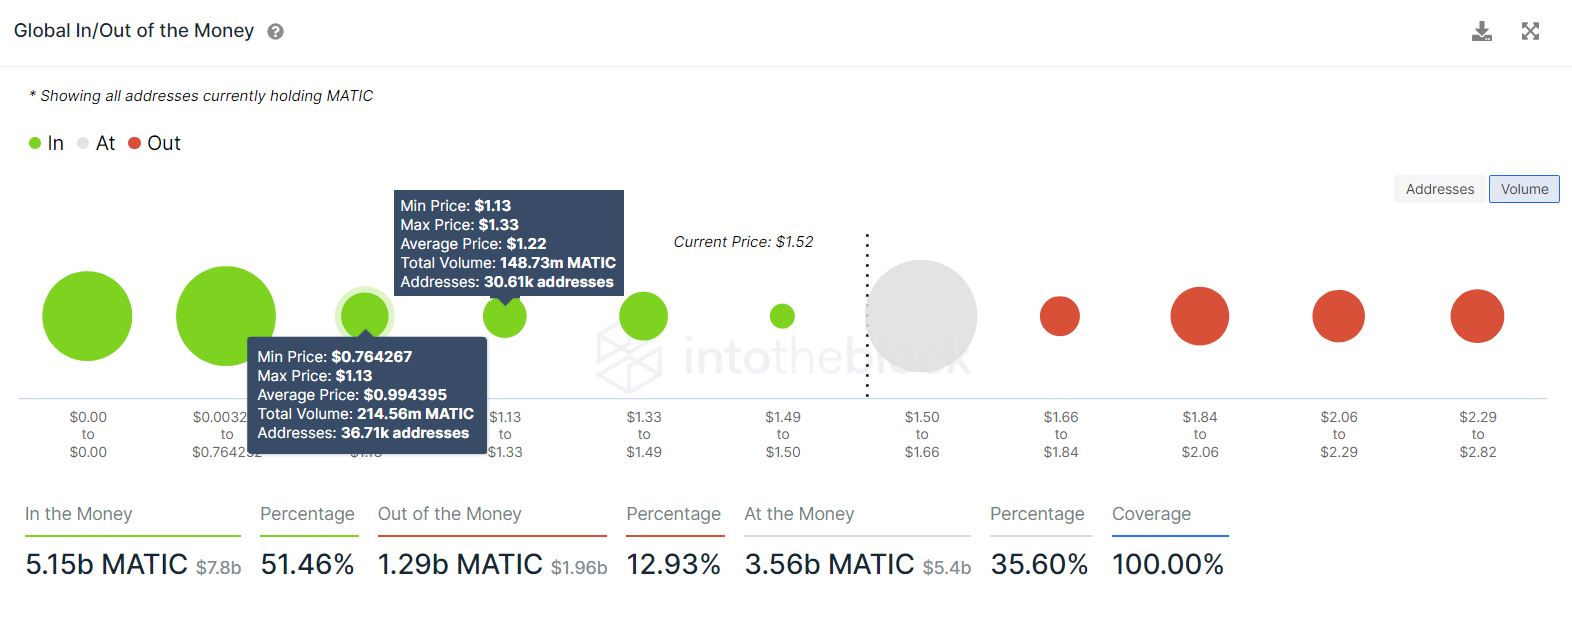
MATIC GIOM
Further depicting the grim nature of MATIC price is the exodus of high net worth individuals or investors. The number of large transactions worth $100,000 or more has dropped from 875 to 243. This 72% decline indicates that these whales are uninterested in MATIC prices at the current levels.
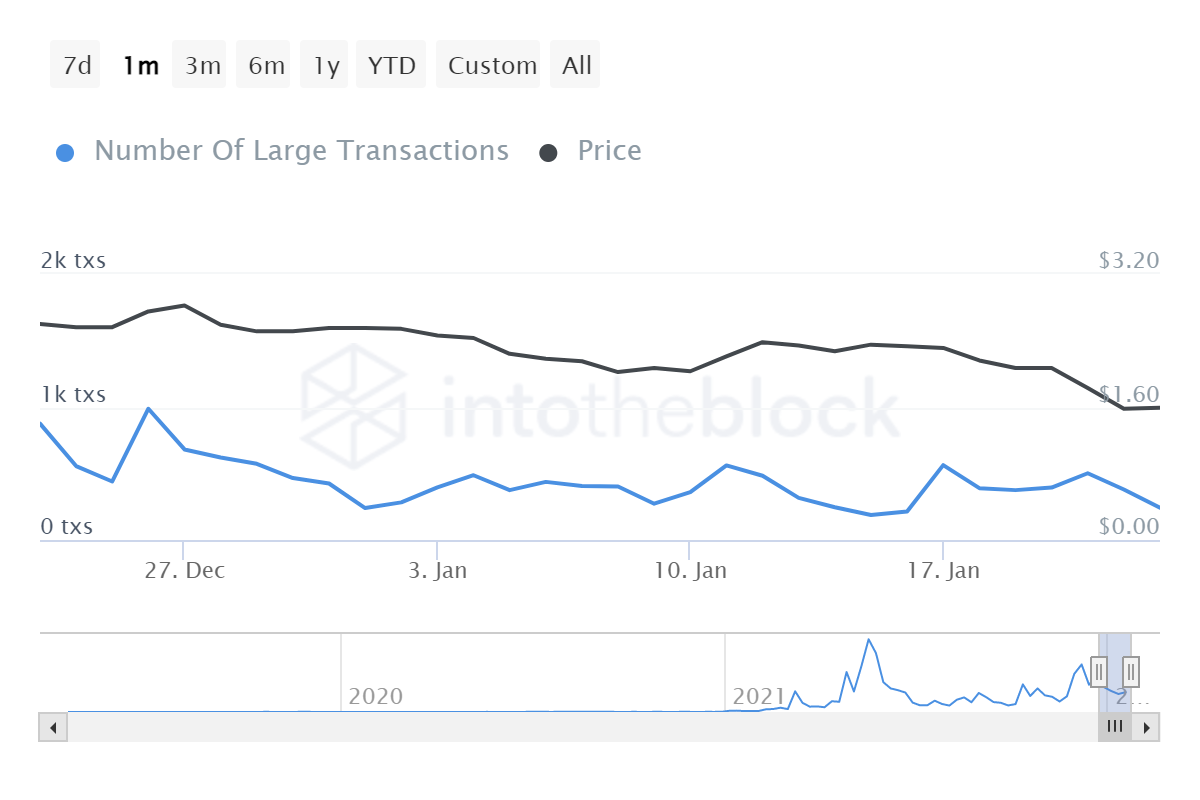
MATIC large transactions
On the other hand, if MATIC price bounces off the $1.22 or $1.44 support level, there is a good chance it will retest the $1.75 to $2.14 supply zone. A daily candlestick close above $2.14 will invalidate the bearish thesis. This development could be the key to pushing MATIC price to its all-time high at $2.92.
Author

Akash Girimath
FXStreet
Akash Girimath is a Mechanical Engineer interested in the chaos of the financial markets. Trying to make sense of this convoluted yet fascinating space, he switched his engineering job to become a crypto reporter and analyst.


