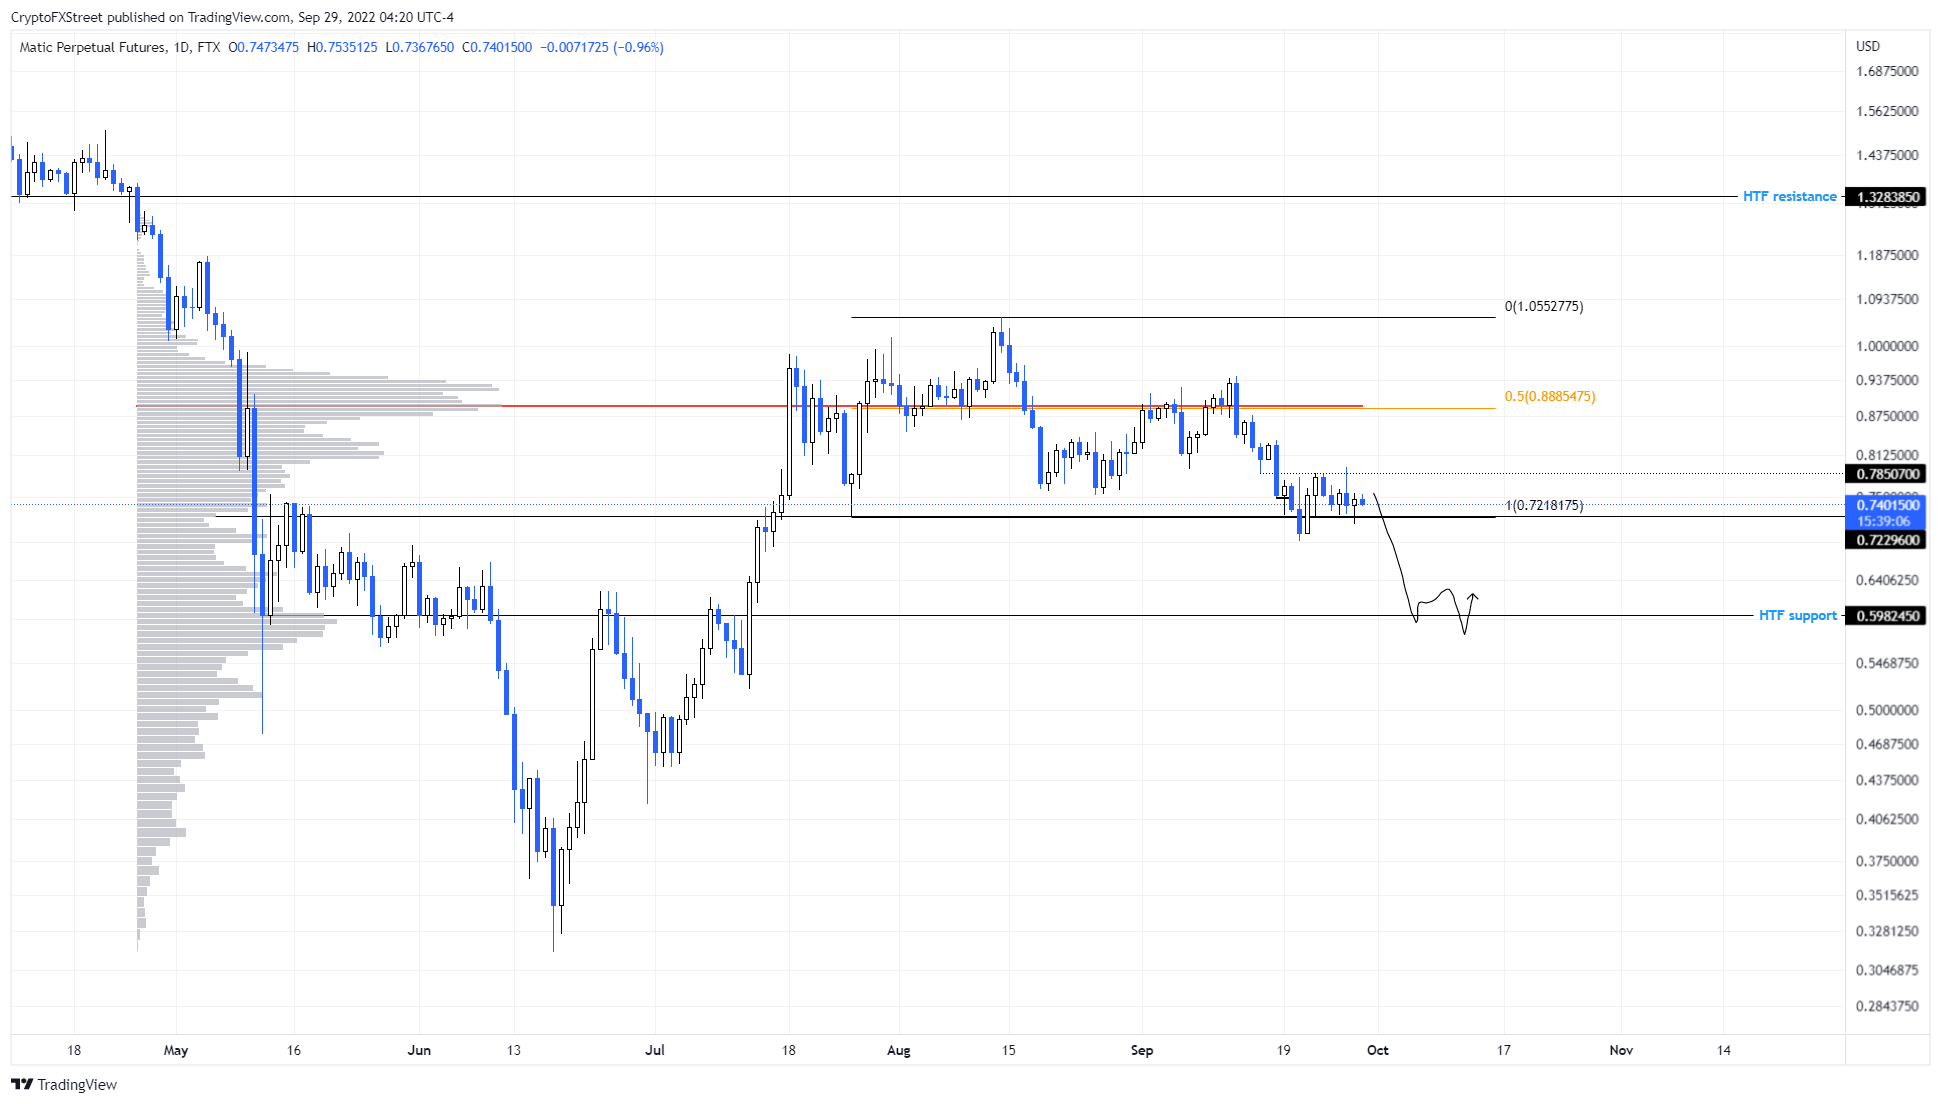
- MATIC price shows a tight consolidation around the range low at $0.721.
- A breakdown of this level could trigger a 20% correction to $0.598.
- On the other hand, a resurgence of buying pressure that flips the $0.885 hurdle into a support level will invalidate Polygon’s bearish fate.
MATIC price prepares for a volatile move as it continues to consolidate for nearly ten days. This development could result in a bearish move, especially if the immediate support level is breached.
MATIC price ready to show its hand
MATIC price has been rangebound between the $0.721 and $1.055 barriers for over three months. Over the last ten days, however, it seems to be hovering around the range low and is showing signs of breaking down.
Supporting MATIC price and its bearish outlook is the $0.721 to $0.598 low volume node gap represented by volume profile. This gap is an imbalance, which will be filled quickly upon the breakdown of the $0.721 level.
In total, investors can expect MATIC price to drop nearly 20% from its current position and form a base around the $0.598 barrier.
MATIC/USDT 4-hour chart
Regardless of the imbalances, investors should pay attention to Bitcoin price, which determines the directional bias of the crypto markets, including altcoins such as Polygon. If the big crypto decides to head higher, MATIC price will follow suit.
Under these circumstances, if MATIC price flips the range’s midpoint at $0.888, it will invalidate the bearish thesis and motivate sidelined buyers to step in and propel Polygon to retest the range high at $1.055.
This move, however, would constitute a 42% ascent from the current position and 18% from the said midpoint.
Information on these pages contains forward-looking statements that involve risks and uncertainties. Markets and instruments profiled on this page are for informational purposes only and should not in any way come across as a recommendation to buy or sell in these assets. You should do your own thorough research before making any investment decisions. FXStreet does not in any way guarantee that this information is free from mistakes, errors, or material misstatements. It also does not guarantee that this information is of a timely nature. Investing in Open Markets involves a great deal of risk, including the loss of all or a portion of your investment, as well as emotional distress. All risks, losses and costs associated with investing, including total loss of principal, are your responsibility. The views and opinions expressed in this article are those of the authors and do not necessarily reflect the official policy or position of FXStreet nor its advertisers. The author will not be held responsible for information that is found at the end of links posted on this page.
If not otherwise explicitly mentioned in the body of the article, at the time of writing, the author has no position in any stock mentioned in this article and no business relationship with any company mentioned. The author has not received compensation for writing this article, other than from FXStreet.
FXStreet and the author do not provide personalized recommendations. The author makes no representations as to the accuracy, completeness, or suitability of this information. FXStreet and the author will not be liable for any errors, omissions or any losses, injuries or damages arising from this information and its display or use. Errors and omissions excepted.
The author and FXStreet are not registered investment advisors and nothing in this article is intended to be investment advice.
Recommended Content
Editors’ Picks

President Trump's memecoin leads crypto unlock with incoming supply pressure of over $320 million
Official Trump, launched by President Trump, will unlock over $320 million worth of its tokens to team members next week despite the dominant risk-off sentiment across the crypto market.

Bitcoin and crypto market sees recovery as Fed official says agency ready to stabilize market if necessary
Bitcoin rallied 5% on Friday, trading just below $84,000 following Susan Collins, head of the Boston Federal Reserve, hinting that the agency could stabilize markets with "various tools" if needed.

Bitcoin, Ethereum and XRP steady as China slaps 125% tariff on US, weekend sell-off looming?
The cryptocurrency market shows stability at the time of writing on Friday, with Bitcoin holding steady at $82,584, Ethereum at $1,569, and Ripple maintaining its position above $2.00.

Bitcoin, Ethereum, Dogecoin and Cardano stabilze – Why crypto is in limbo
Crypto traders are digesting US President Donald Trump’s Liberation Day announcements last week, the tariff truce declared on Wednesday and the worsening situation with China, as the industry wraps one of its worst weeks in terms of price swings.

Bitcoin Weekly Forecast: Market uncertainty lingers, Trump’s 90-day tariff pause sparks modest recovery
Bitcoin (BTC) price extends recovery to around $82,500 on Friday after dumping to a new year-to-date low of $74,508 to start the week. Market uncertainty remains high, leading to a massive shakeout, with total liquidations hitting $2.18 billion across crypto markets.

The Best brokers to trade EUR/USD
SPONSORED Discover the top brokers for trading EUR/USD in 2025. Our list features brokers with competitive spreads, fast execution, and powerful platforms. Whether you're a beginner or an expert, find the right partner to navigate the dynamic Forex market.