- Polygon price action prints a slight fade on Monday in front of the monthly R1 pivot level.
- MATIC price action sees two technical indicators set to cross one another.
- Should the crossing extend, a golden period with plenty of profit is nearby.
Polygon (MATIC) price action saw traders putting forward their bets for the fall and winter as price action rocketed 8%. A small fade this Monday morning is not that strange: China markets tanked massively, and the nearby vicinity of the monthly R1 resistance level is triggering some profit-taking. Two big important technical indicators are trading almost at the same price and could be seen crossing into a bullish sentiment outlook for the coming months.
MATIC price set for a bullish blitzkrieg of 33% gains
Polygon price action saw a massive wave of bullishness on Sunday as price action jumped over 8% for the day. That move hit $0.909 on Monday morning, which is very near the monthly R1 resistance level at $0.920. Today's fade is quite normal, seeing that Asian stock markets tanked over 6% and some China tech stocks declined even more than 10%, with big names like Alibaba and Tencent on the back foot after the China Party Congress. It is possible that a big position switch is happening as the 55-day Simple Moving Average (SMA) is set to cross the 200-day SMA.
MATIC price action will probably rally firmly over the coming weeks and months, following the MA cross. This could be a reflection of the fact that the worst has been priced in now, and it is just a matter of buying into the market at what is likely to be the year's low. MATIC price action could see a pop above $0.96 this week, breaking above the high of July 20th, 2021. This opens room and prospects for a move beyond $1 to $1.20 at the high of July 4, 2021, which is near the monthly R3 resistance level.
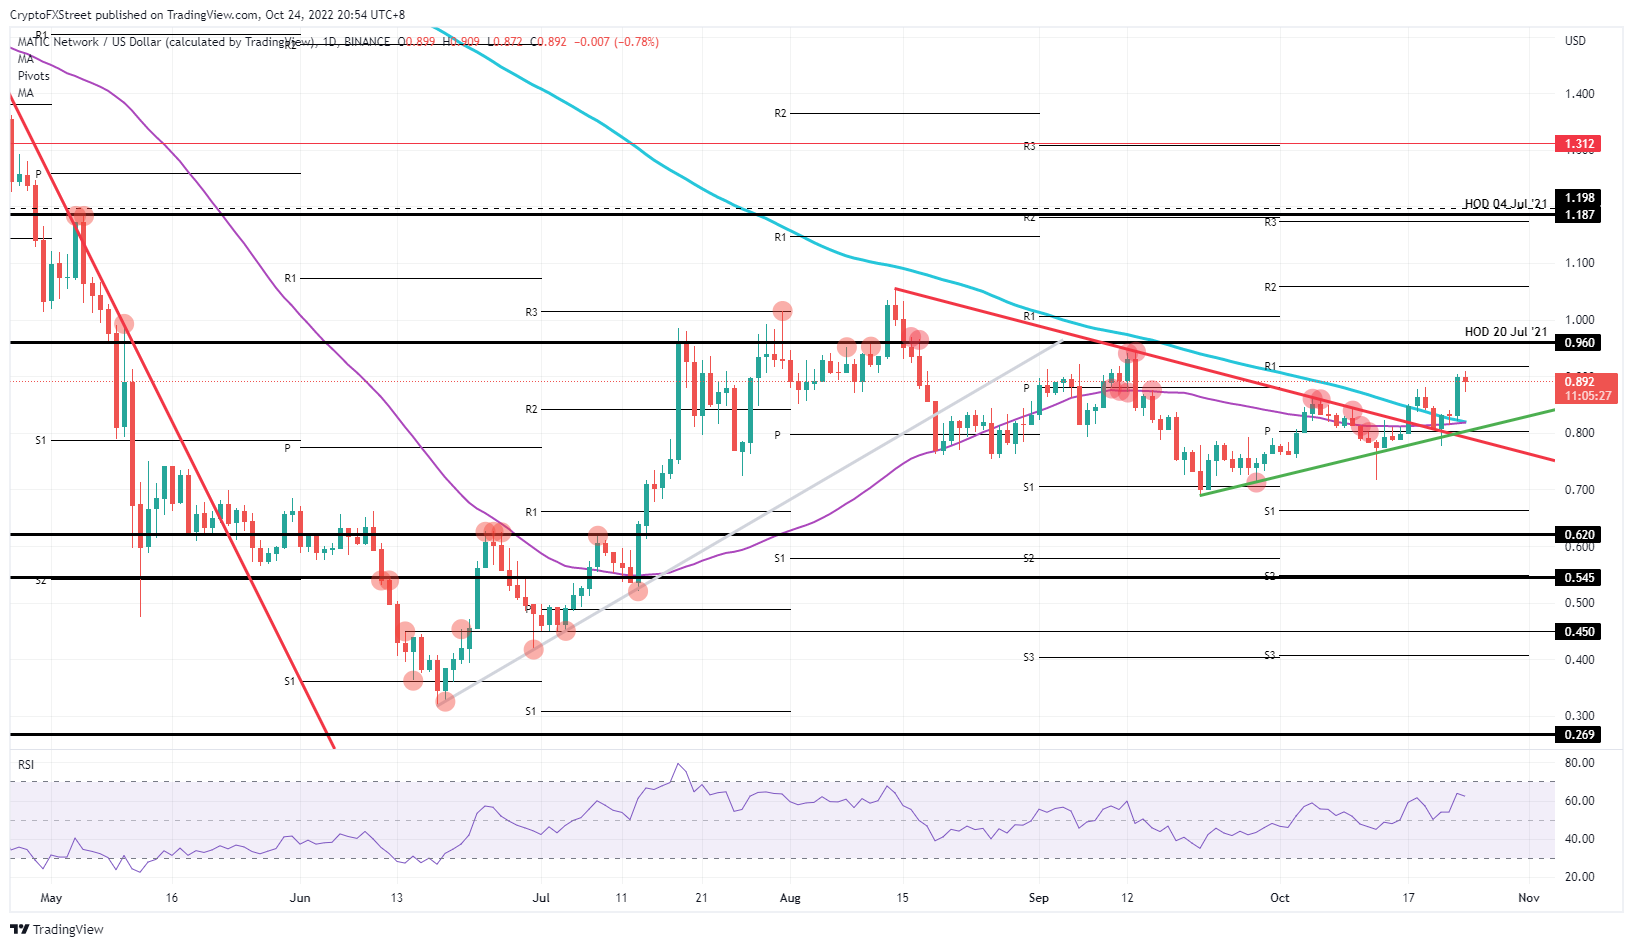
MATIC/USD Daily chart
Of course, there is still a risk price could fall and the 55-day SMA trade near to but not quite succeed in crossing above the 200-day SMA. That would probably result in bulls pulling their funds from Sunday to book small quick gains. In such a situation, price action would collapse and drop back to $0.62 as the green trend line would break to the downside.
Information on these pages contains forward-looking statements that involve risks and uncertainties. Markets and instruments profiled on this page are for informational purposes only and should not in any way come across as a recommendation to buy or sell in these assets. You should do your own thorough research before making any investment decisions. FXStreet does not in any way guarantee that this information is free from mistakes, errors, or material misstatements. It also does not guarantee that this information is of a timely nature. Investing in Open Markets involves a great deal of risk, including the loss of all or a portion of your investment, as well as emotional distress. All risks, losses and costs associated with investing, including total loss of principal, are your responsibility. The views and opinions expressed in this article are those of the authors and do not necessarily reflect the official policy or position of FXStreet nor its advertisers. The author will not be held responsible for information that is found at the end of links posted on this page.
If not otherwise explicitly mentioned in the body of the article, at the time of writing, the author has no position in any stock mentioned in this article and no business relationship with any company mentioned. The author has not received compensation for writing this article, other than from FXStreet.
FXStreet and the author do not provide personalized recommendations. The author makes no representations as to the accuracy, completeness, or suitability of this information. FXStreet and the author will not be liable for any errors, omissions or any losses, injuries or damages arising from this information and its display or use. Errors and omissions excepted.
The author and FXStreet are not registered investment advisors and nothing in this article is intended to be investment advice.
Recommended Content
Editors’ Picks

Bitcoin Weekly Forecast: BTC nosedives below $95,000 as spot ETFs record highest daily outflow since launch
Bitcoin price continues to edge down, trading below $95,000 on Friday after declining more than 9% this week. Bitcoin US spot ETFs recorded the highest single-day outflow on Thursday since their launch in January.

Bitcoin crashes to $96,000, altcoins bleed: Top trades for sidelined buyers
Bitcoin (BTC) slipped under the $100,000 milestone and touched the $96,000 level briefly on Friday, a sharp decline that has also hit hard prices of other altcoins and particularly meme coins.

Solana Price Forecast: SOL’s technical outlook and on-chain metrics hint at a double-digit correction
Solana (SOL) price trades in red below $194 on Friday after declining more than 13% this week. The recent downturn has led to $38 million in total liquidations, with over $33 million coming from long positions.

SEC approves Hashdex and Franklin Templeton's combined Bitcoin and Ethereum crypto index ETFs
The SEC approved Hashdex's proposal for a crypto index ETF. The ETF currently features Bitcoin and Ethereum, with possible additions in the future. The agency also approved Franklin Templeton's amendment to its Cboe BZX for a crypto index ETF.

Bitcoin: 2025 outlook brightens on expectations of US pro-crypto policy
Bitcoin price has surged more than 140% in 2024, reaching the $100K milestone in early December. The rally was driven by the launch of Bitcoin Spot ETFs in January and the reduced supply following the fourth halving event in April.

Best Forex Brokers with Low Spreads
VERIFIED Low spreads are crucial for reducing trading costs. Explore top Forex brokers offering competitive spreads and high leverage. Compare options for EUR/USD, GBP/USD, USD/JPY, and Gold.