![]() Jonathan Morgan
Jonathan Morgan
Independent Analyst
- MATIC price tests the breakout below the lower trendline of a rising wedge.
- Failure to return inside the rising wedge would likely confirm the breakout and trigger a sell-off.
- A successful move above resistance would generate a powerful bear trap.
MATIC price action dropped below the lower trendline of a rising wedge last Friday. That move was the first close below that pattern since it was discovered in September 2021. As a result, trading opportunities for both sides of the market are now present.
MATIC price must return and close above the $2.20 value area to deny bears a bearish breakout
MATIC price is sitting in a tough spot. Saturday's close has contributed to more bearish activity and pushed MATIC to the first close below the daily Cloud since November 27, 2021. However, bulls staved off any further selling pressure with some intense buying pressure on Sunday to close MATIC higher by nearly 7% and to a close above the Cloud – but just below the lower trend line of the rising wedge.
There is a theoretical long setup on the $0.01/3-box reversal Point and Figure chart for MATIC price. The long setup is a buy stop order at $2.16, a stop loss at $2.12, and a profit target at $2.30. The entry is based on the breakout above a triple-top and the neckline of an inverse head and shoulders pattern. The trade idea represents a 3.5:1 reward for the risk setup. The projected profit targets would put MATIC comfortably back inside the rising wedge pattern on the daily candlestick chart.
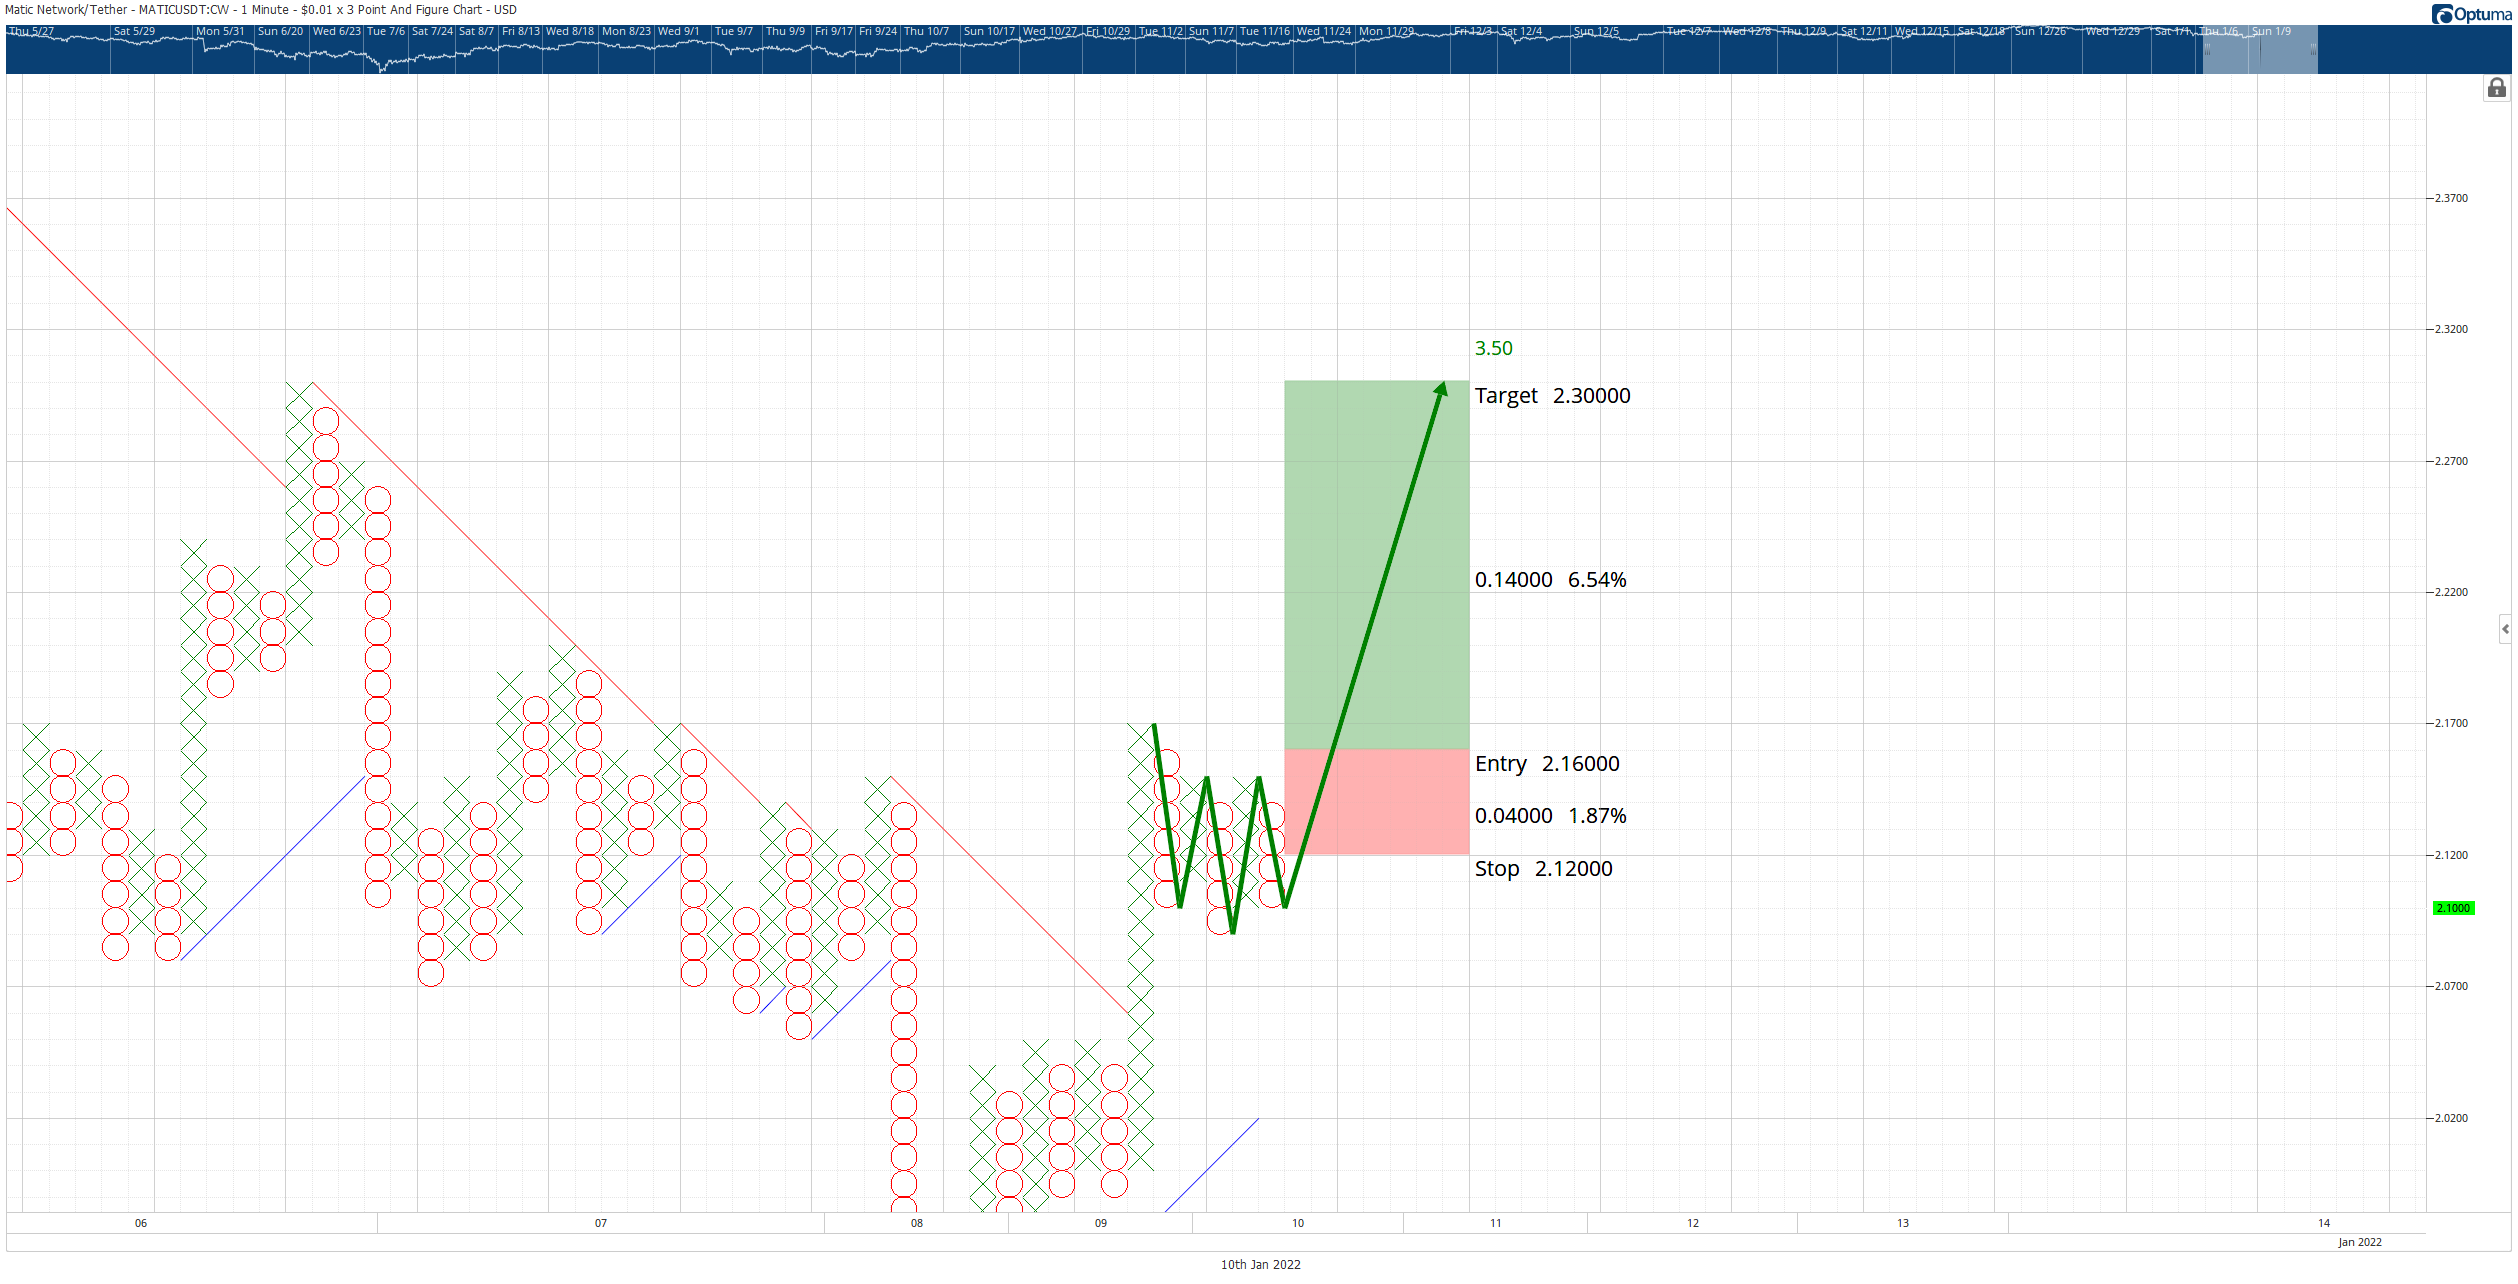
MATIC/USDT $0.01/3-box Reversal Point and Figure Chart
The theoretical long setup is invalidated if the short idea below is triggered first.
If resistance against the lower trend line holds and MATIC price begins to drop, there is a fantastic short opportunity. The hypothetical short setup is a sell stop order at $1.98, a stop loss at $2.17, and a profit target at $1.40. In addition, the daily close must be at or slightly below the $1.98 entry. If the short setup is triggered, it will fulfill all conditions required for an Ideal Bearish Ichimoku Breakout setup – an entry that portends a significant drop to new three-month lows.
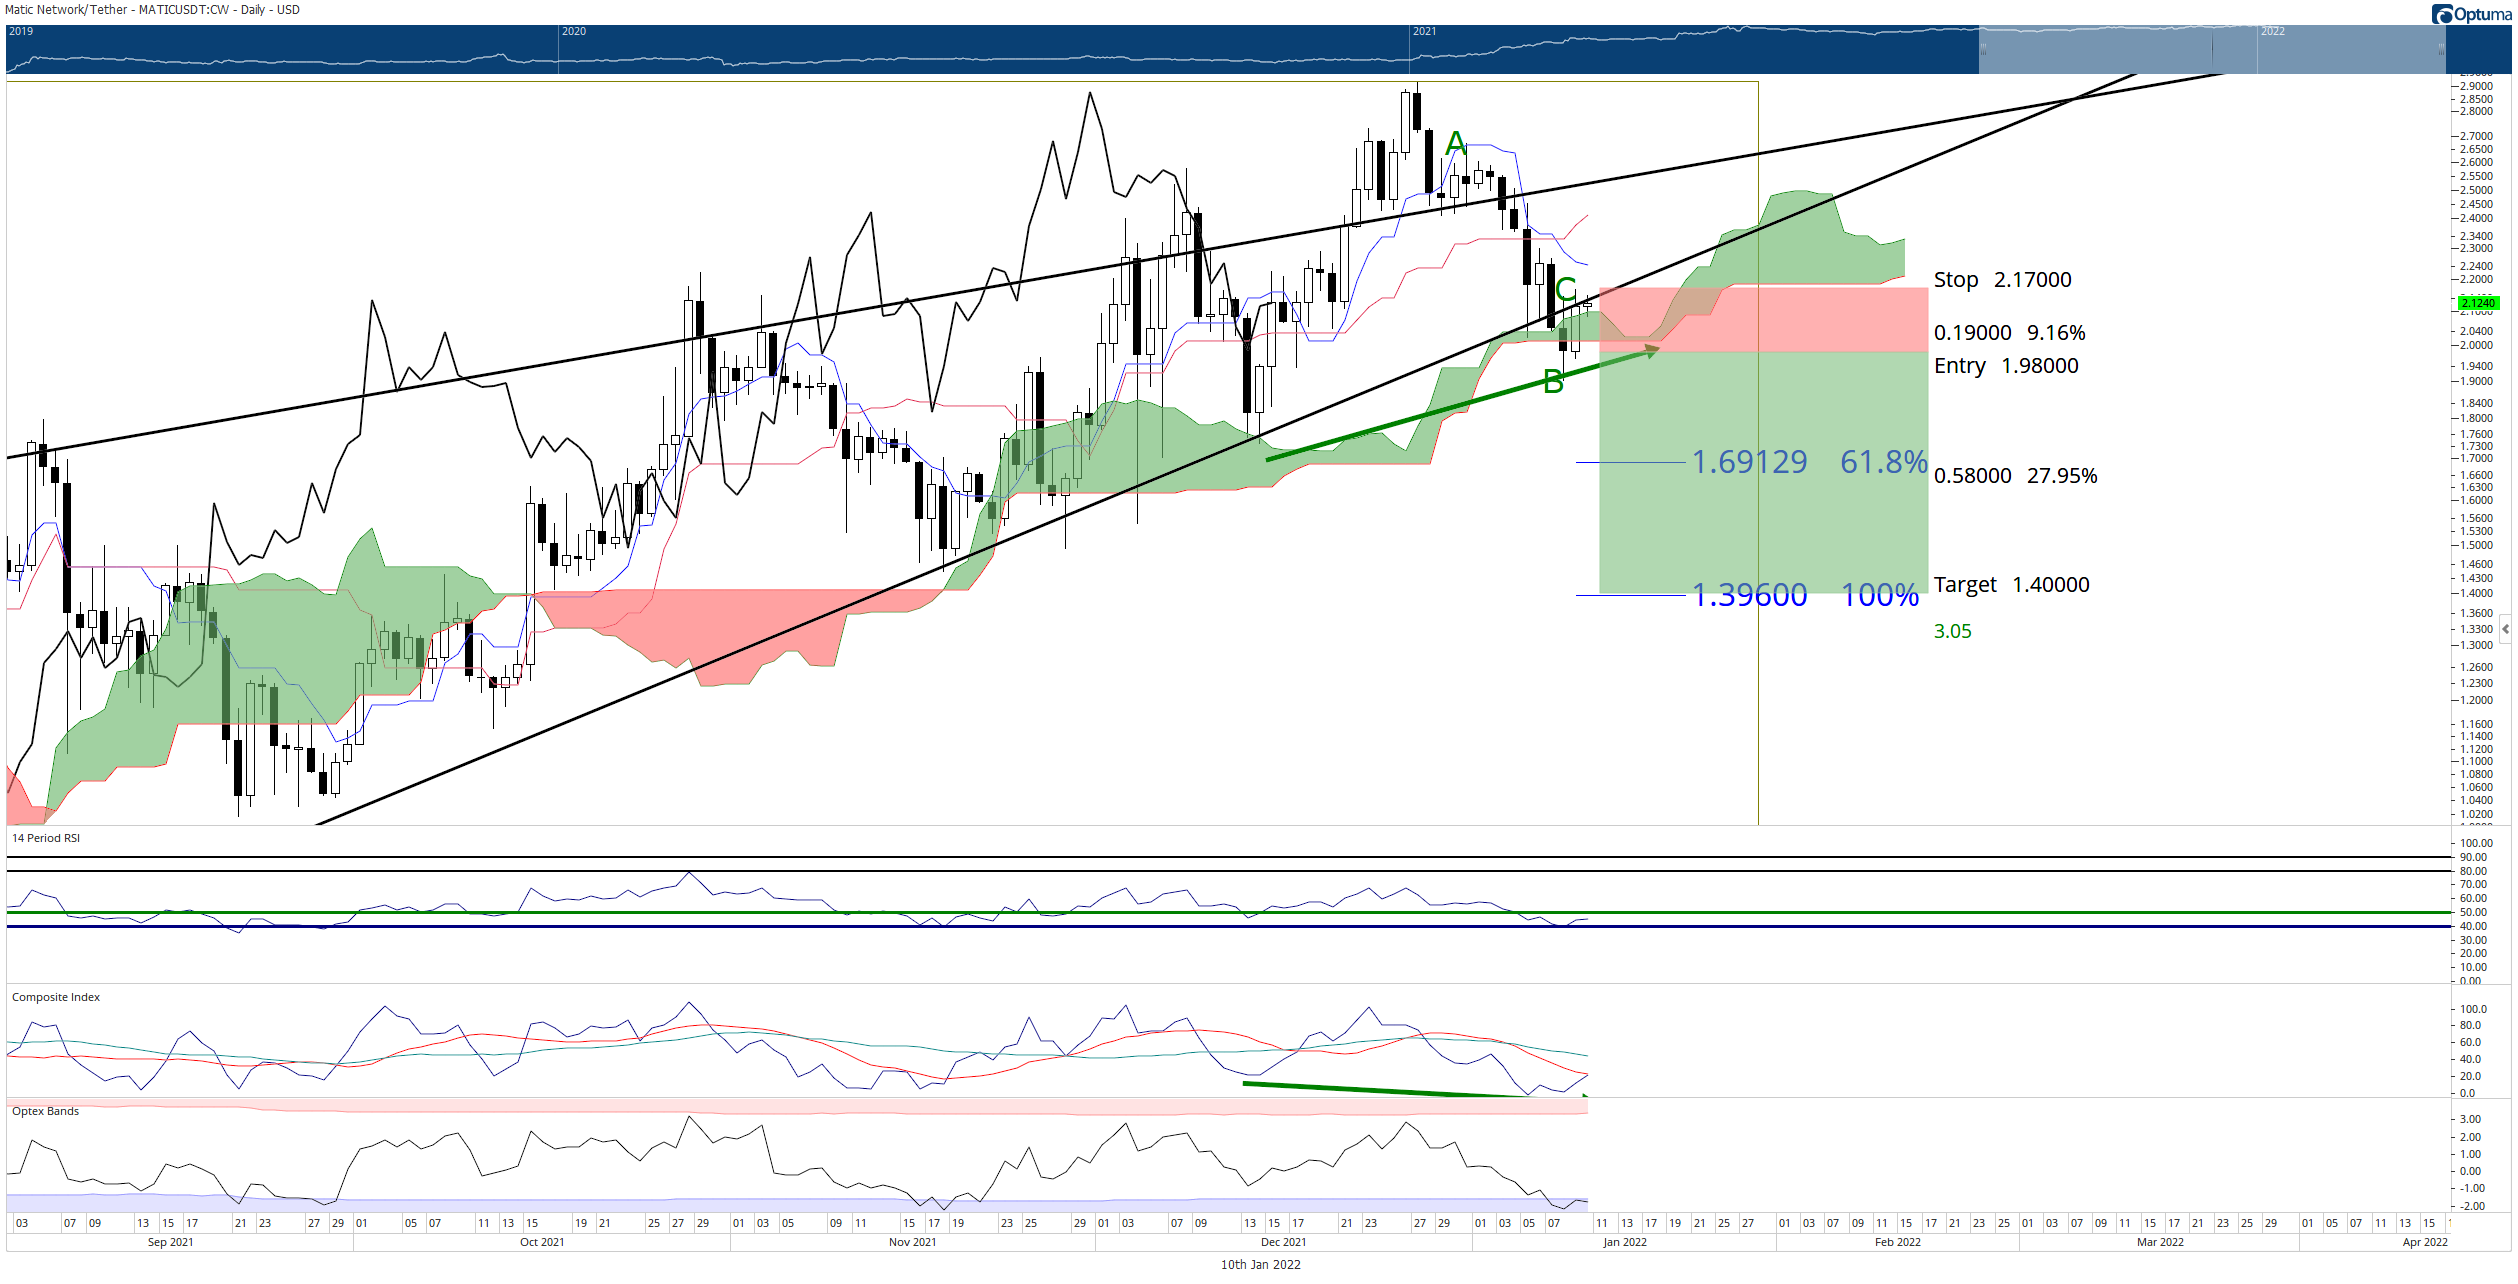
MATIC/USDT Daily Ichimoku Chart
The short setup is invalidated if MATIC price reaches $2.50 before triggered entry.
Note: All information on this page is subject to change. The use of this website constitutes acceptance of our user agreement. Please read our privacy policy and legal disclaimer. Opinions expressed at FXstreet.com are those of the individual authors and do not necessarily represent the opinion of FXstreet.com or its management. Risk Disclosure: Trading foreign exchange on margin carries a high level of risk, and may not be suitable for all investors. The high degree of leverage can work against you as well as for you. Before deciding to invest in foreign exchange you should carefully consider your investment objectives, level of experience, and risk appetite. The possibility exists that you could sustain a loss of some or all of your initial investment and therefore you should not invest money that you cannot afford to lose. You should be aware of all the risks associated with foreign exchange trading, and seek advice from an independent financial advisor if you have any doubts.
Recommended Content
Editors’ Picks

PEPE Price Forecast: PEPE could rally to double digits if it breaks above its key resistance level
Pepe (PEPE) memecoin approaches its descending trendline, trading around $0.000007 on Tuesday; a breakout indicates a bullish move ahead.

Tron Price Prediction: Tether’s $1B move triggers TRX ahead of US Congress stablecoin bill review on Wednesday
Tron price defied the broader crypto market downtrend, surging 3% to $0.25 on Monday. This bullish momentum comes as stablecoin issuer Tether minted another $1 billion worth of USDT on the Tron network, according to on-chain data from Arkham.

Ethereum Price Forecast: Short-term holders spark $400 million in realized losses, staking flows surge
Ethereum (ETH) bounced off the $1,800 support on Monday following increased selling pressure from short-term holders (STHs) and tensions surrounding President Donald Trump's reciprocal tariff kick-off on April 2.

BlackRock CEO warns Bitcoin could replace US Dollar as global reserve currency, crypto ETFs witness inflows
BlackRock CEO Larry Fink stated in an annual letter to investors on Monday that the US national debt could cause the Dollar's global reserve status to be replaced with Bitcoin if investors begin to see the digital currency as a safer asset.

Bitcoin: BTC remains calm before a storm
Bitcoin's price has been consolidating between $85,000 and $88,000 this week. A K33 report explains how the markets are relatively calm and shaping up for volatility as traders absorb the tariff announcements. PlanB’s S2F model shows that Bitcoin looks extremely undervalued compared to Gold and the housing market.

The Best brokers to trade EUR/USD
SPONSORED Discover the top brokers for trading EUR/USD in 2025. Our list features brokers with competitive spreads, fast execution, and powerful platforms. Whether you're a beginner or an expert, find the right partner to navigate the dynamic Forex market.