Market Timing with the Bitcoin Z-Signal

In my quest to provide investors with powerful tools they can use to understand the Bitcoin markets; I am proud to introduce to you the latest addition to my toolkit, the Bitcoin Z-Signal. The Bitcoin Z-Signal is based on an analysis of data produced by the blockchain, and its usefulness in modeling Bitcoin's growth using the ideas behind Metcalfe's Law.
The idea was to create a simple, timely way to understand the current phase of the market that was not based on technical analysis, but rather looked at the fundamentals of the Bitcoin network itself. In so doing, we can eliminate much of the complication involved and help you do what you need to do, which is to make a decision (buy, sell, or wait).
The Charts
Each day, I post an update to the Bitcoin Z-Signal via Twitter. The two charts that I include each day are the long view, and a zoomed in view focusing just on the Z-Score. Let's take a look at the latest charts, published December 3, 2018.

What you're seeing here is a long view of the Bitcoin price on the left Y-axis in log scale. On the right Yaxis you're seeing the Z-score of the price/predicted by the model in linear scale. The model itself takes in the daily transactions, the number of unique addresses, and the running total of all transactions confirmed on the blockchain.
The three inputs are run through a multiple regression in log scale, and the output is a daily price prediction. The blue area represents the difference between the actual price, and the predicted price. These price/predicted ratios are standardized to give us the Z-scores.
You will notice that the Bitcoin Z-Signal reliably indicates when it might be a good time to sell or enter the market in the long term. The last two waves have each been about two years apart from peak to trough. Let's take a look.
In 2011, we saw a low Z-score of -0.36. Two years later, in 2013, the Z-score spiked to 1.53.
In 2015, we say a low Z-score of -0.41. Two years later, in 2017, the Z-score spiked to 1.21.
As of the time of writing (December 3, 2018), the current Z-score is -0.05.
The next chart is a zoomed in view of the last two years, focusing just on the Z-score portion.
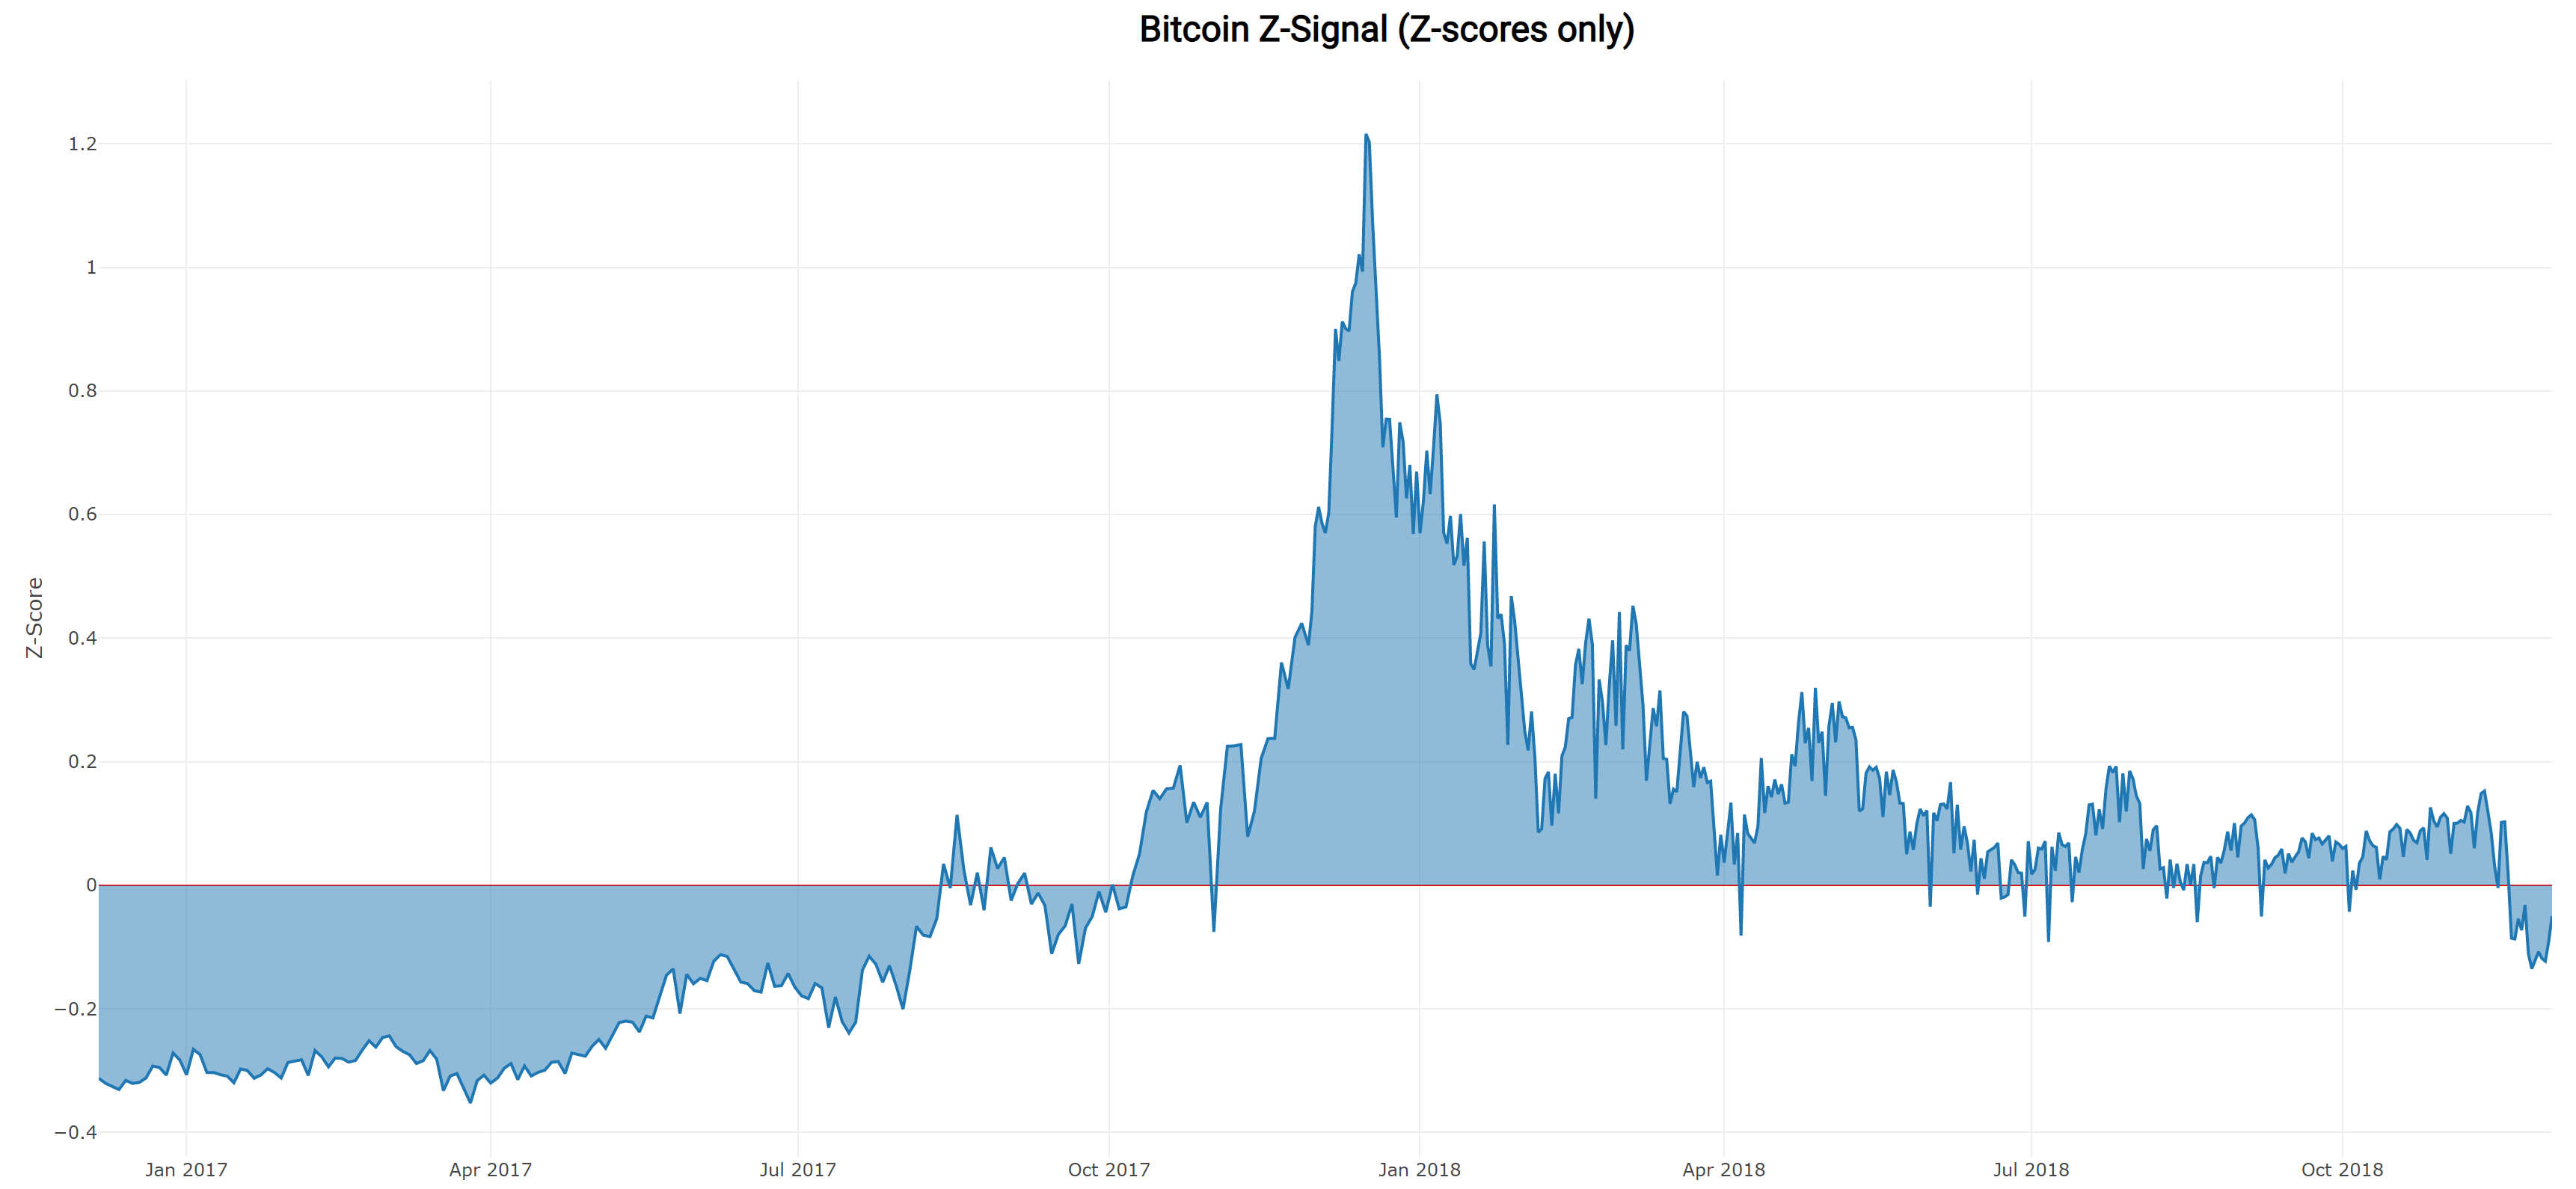
Here you can see that the current price of Bitcoin is actually closer to the predicted value than it was back in early 2017. This would seem to suggest that if this bubble was the of the same magnitude as the last one, we may have further to go before we reach the bottom.
However, there are many differences between today and what happened in the past. Primarily, the last bubble was popped by Mt. Gox, which resulting in 80% of all the trading volume vanishing overnight (80% of the people trading lost their money). This was a big deal. The current bubble was popped by the network not being able to keep up with demand (something that's being worked on right now to much success).
Since the last dip in the market, we've been in (and stayed in) negative Z-score territory. Typically, this has been a good sign that buying season is getting underway. But, a word of caution; we don't know how deep the market bottom could be. So, I suggest considering a dollar cost averaging strategy to protect yourself from extreme price movements, and to lower your average purchase price as we continue downwards.
Additionally, if we end up experiencing a rapid recovery, then following a dollar cost averaging strategy, you will still have caught a piece of the floor. If you use this strategy, in conjunction with a long-term time horizon; you are more likely to end up in the green when you look back later (this is not investment advice, it's just what I do; take it for what it's worth).
The Z-Complex
An inquisitive reader asked me if it was possible to include the predicted values on the chart as well. I like the idea and created a variant of this chart called the Z-Complex. If you have any feedback on this view, feel free to reach out to me and let me know.
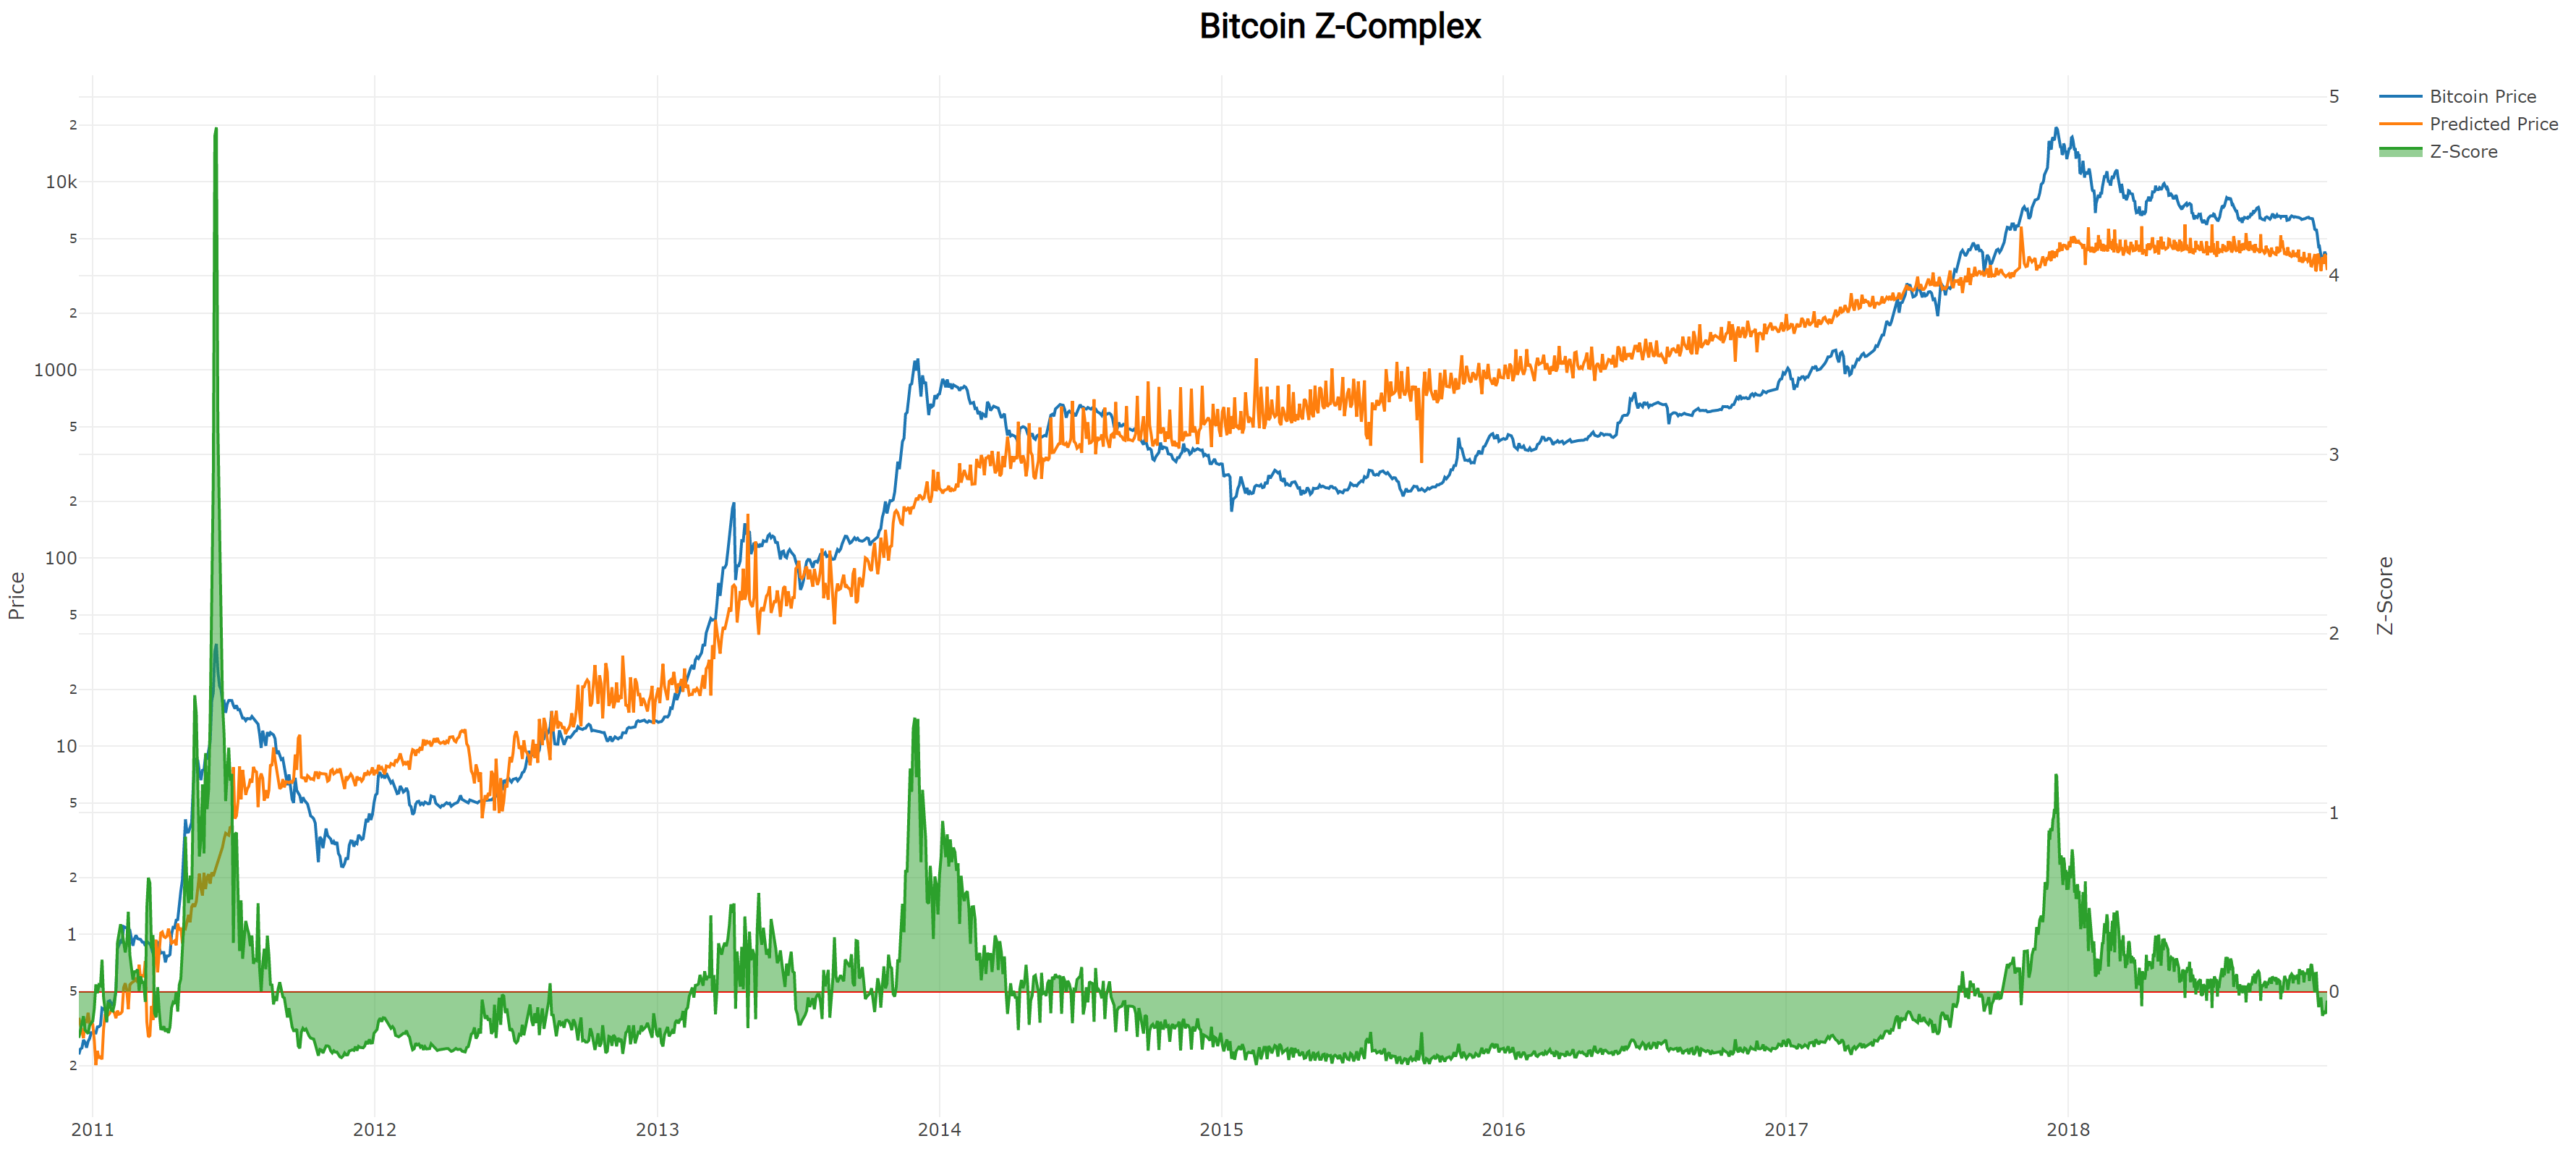
I like this view personally. I think it shows that the expected value of the Bitcoin network is steadily increasing, even though we have speculative mania and big price swings along the way.
Stats for Nerds
Many people have asked me how to replicate this research, and I welcome these questions. If you run a multiple regression on the log values of the total transactions, unique addresses, and daily transactions (the independent variables) against the log value of the price of Bitcoin (in base 10, 2, or e, it doesn't matter), you should see the following results.
Inputs
Log Daily Tx P-value: 4.98275E-87
Log Total Tx P-value: 2.0959E-171
Log Unique Addresses P-value: 3.15007E-85
Regression Statistics
Multiple R 0.970718112 R
Square 0.942293654
Adjusted R Square 0.942191156
Standard Error 0.317717411
Observations 1693
A note about Bitcoin Volatility
Many people have criticized Bitcoin, saying that it can't possibly succeed because it doesn't store value, primarily because it's too volatile. I would like to address these comments and explain why I am a firm believer in the long-term potential of Bitcoin.
First of all, the Bitcoin volatility is decreasing over time. If you zoom out, you will see that this is not an opinion, it's a statistical reality.
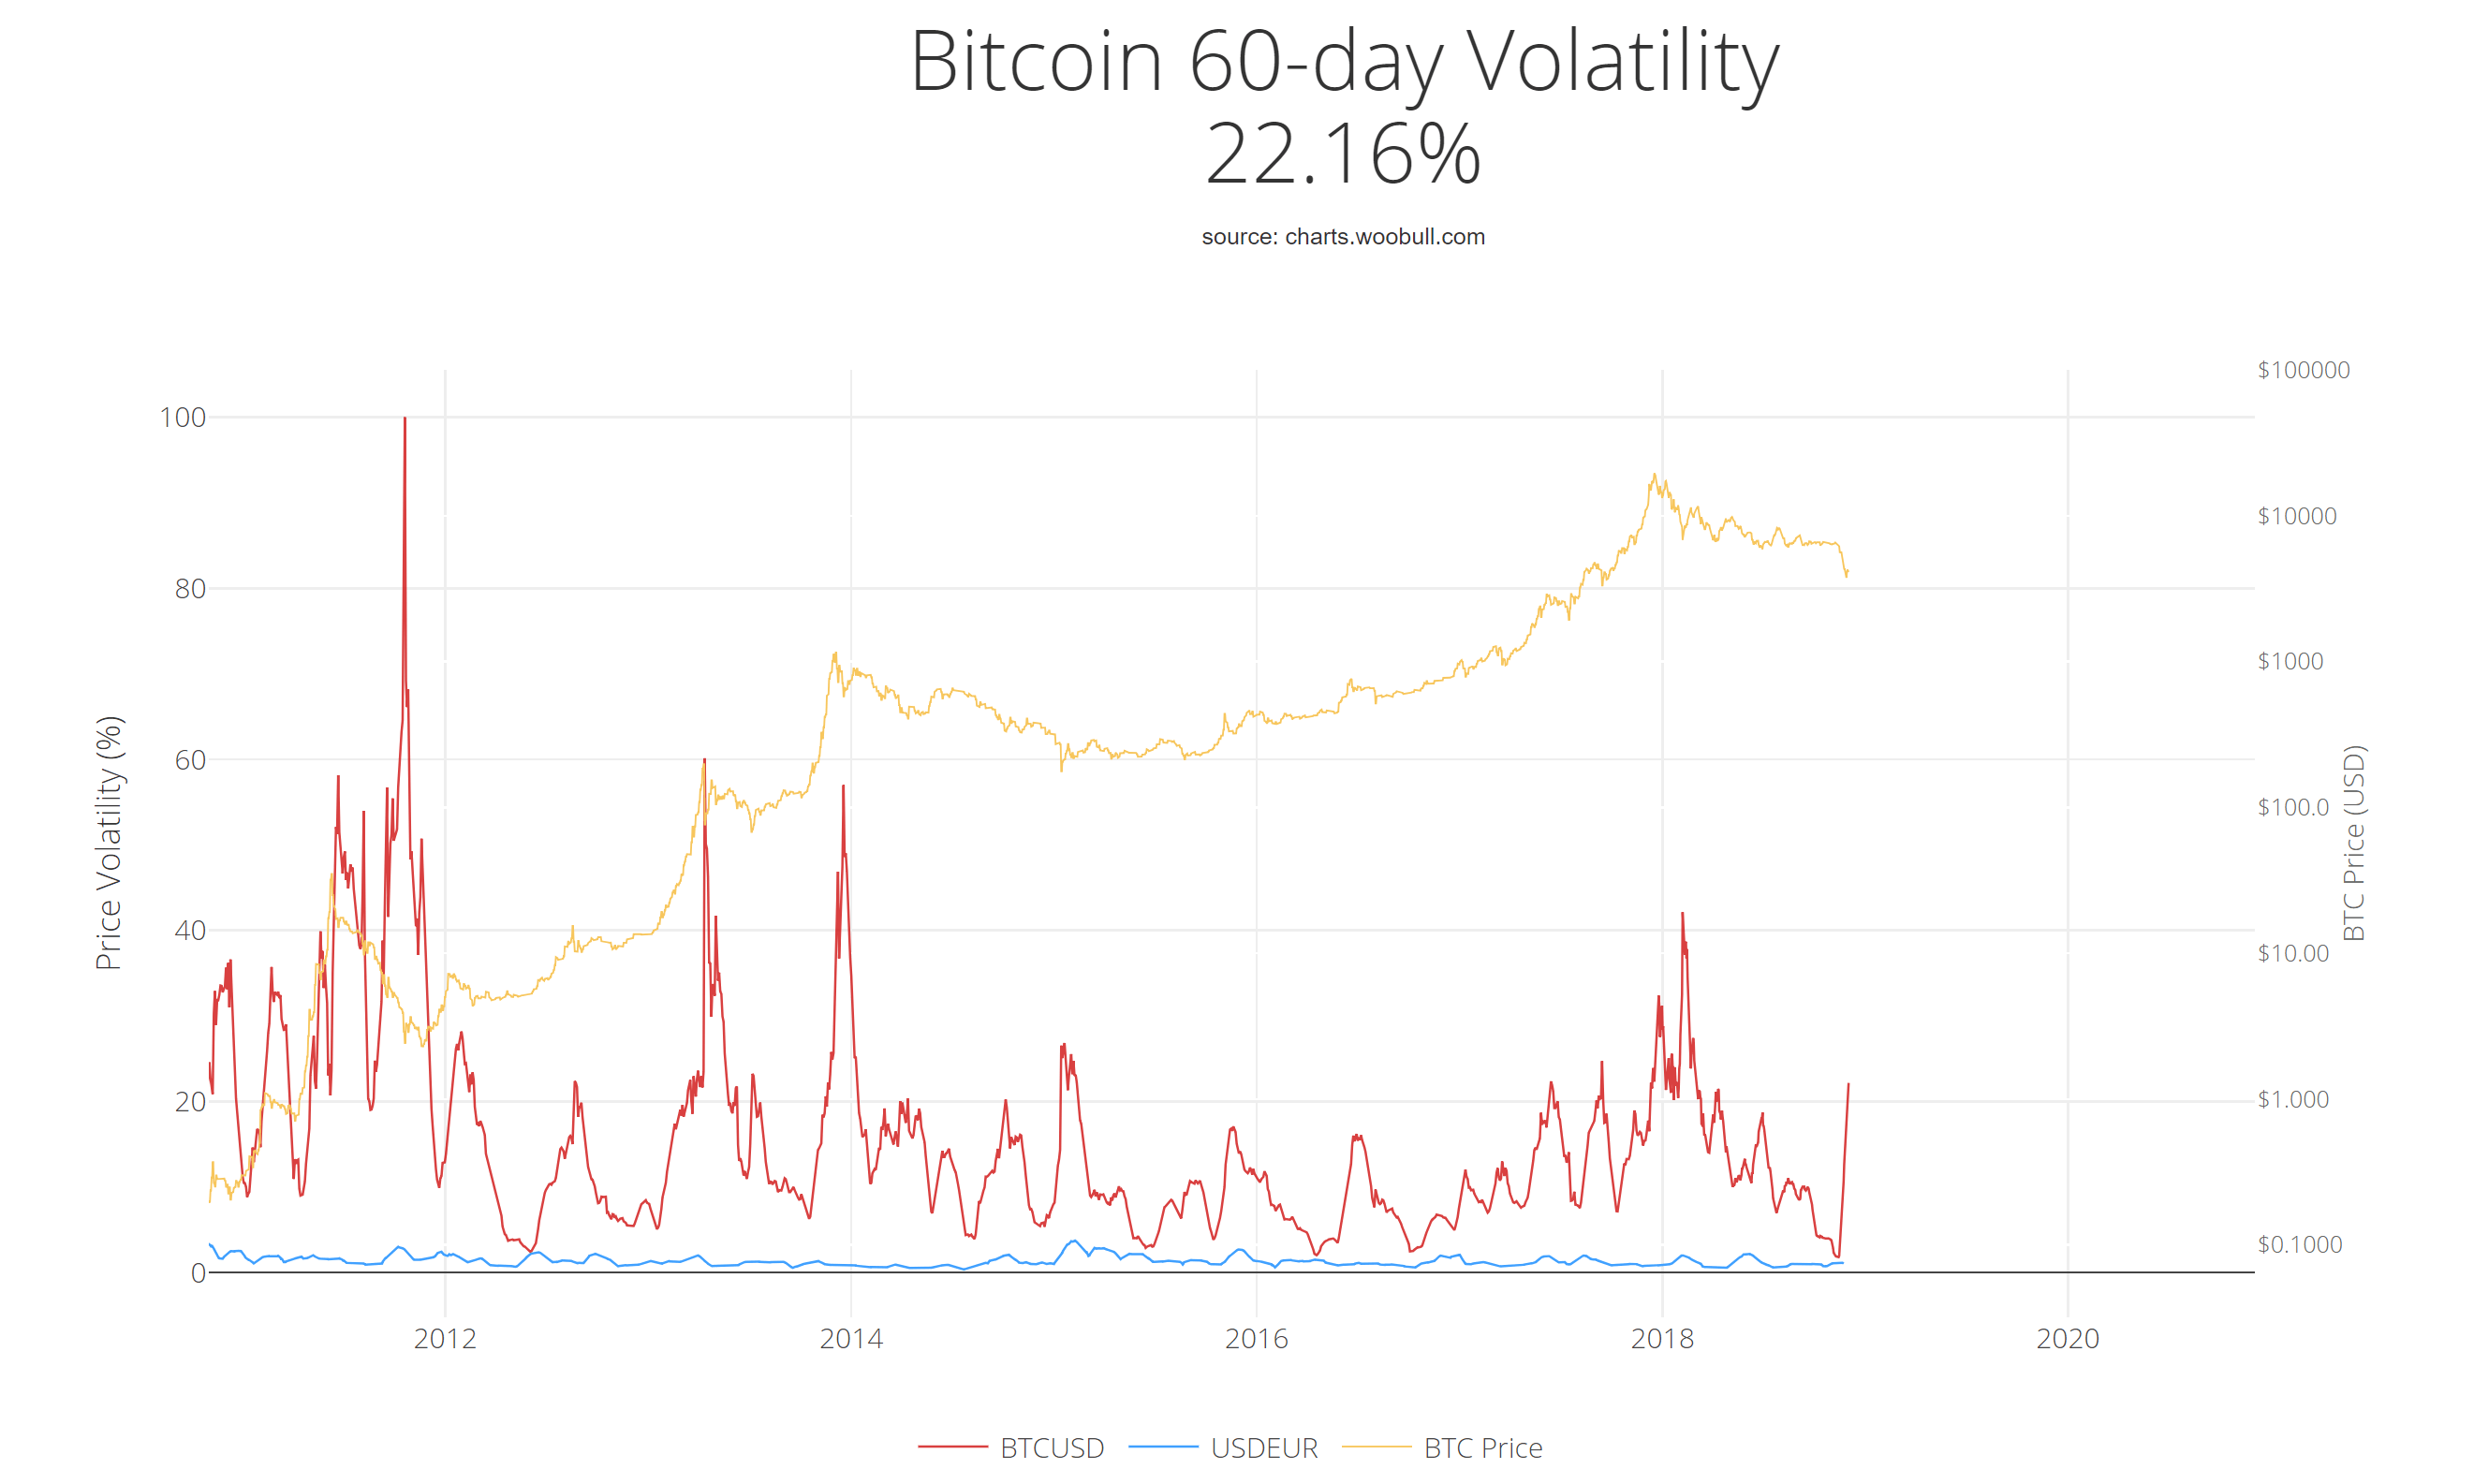
Volatility hit a high just before 2012, then again in 2013, and then in 2018. But, notice how the peaks are getting lower over time? If we think in the correct scale, the trend is obvious.
Secondly, I think some volatility is a good thing, because it's primarily pushing the price of Bitcoin up. The only thing better than storing value is increasing in value! See below:
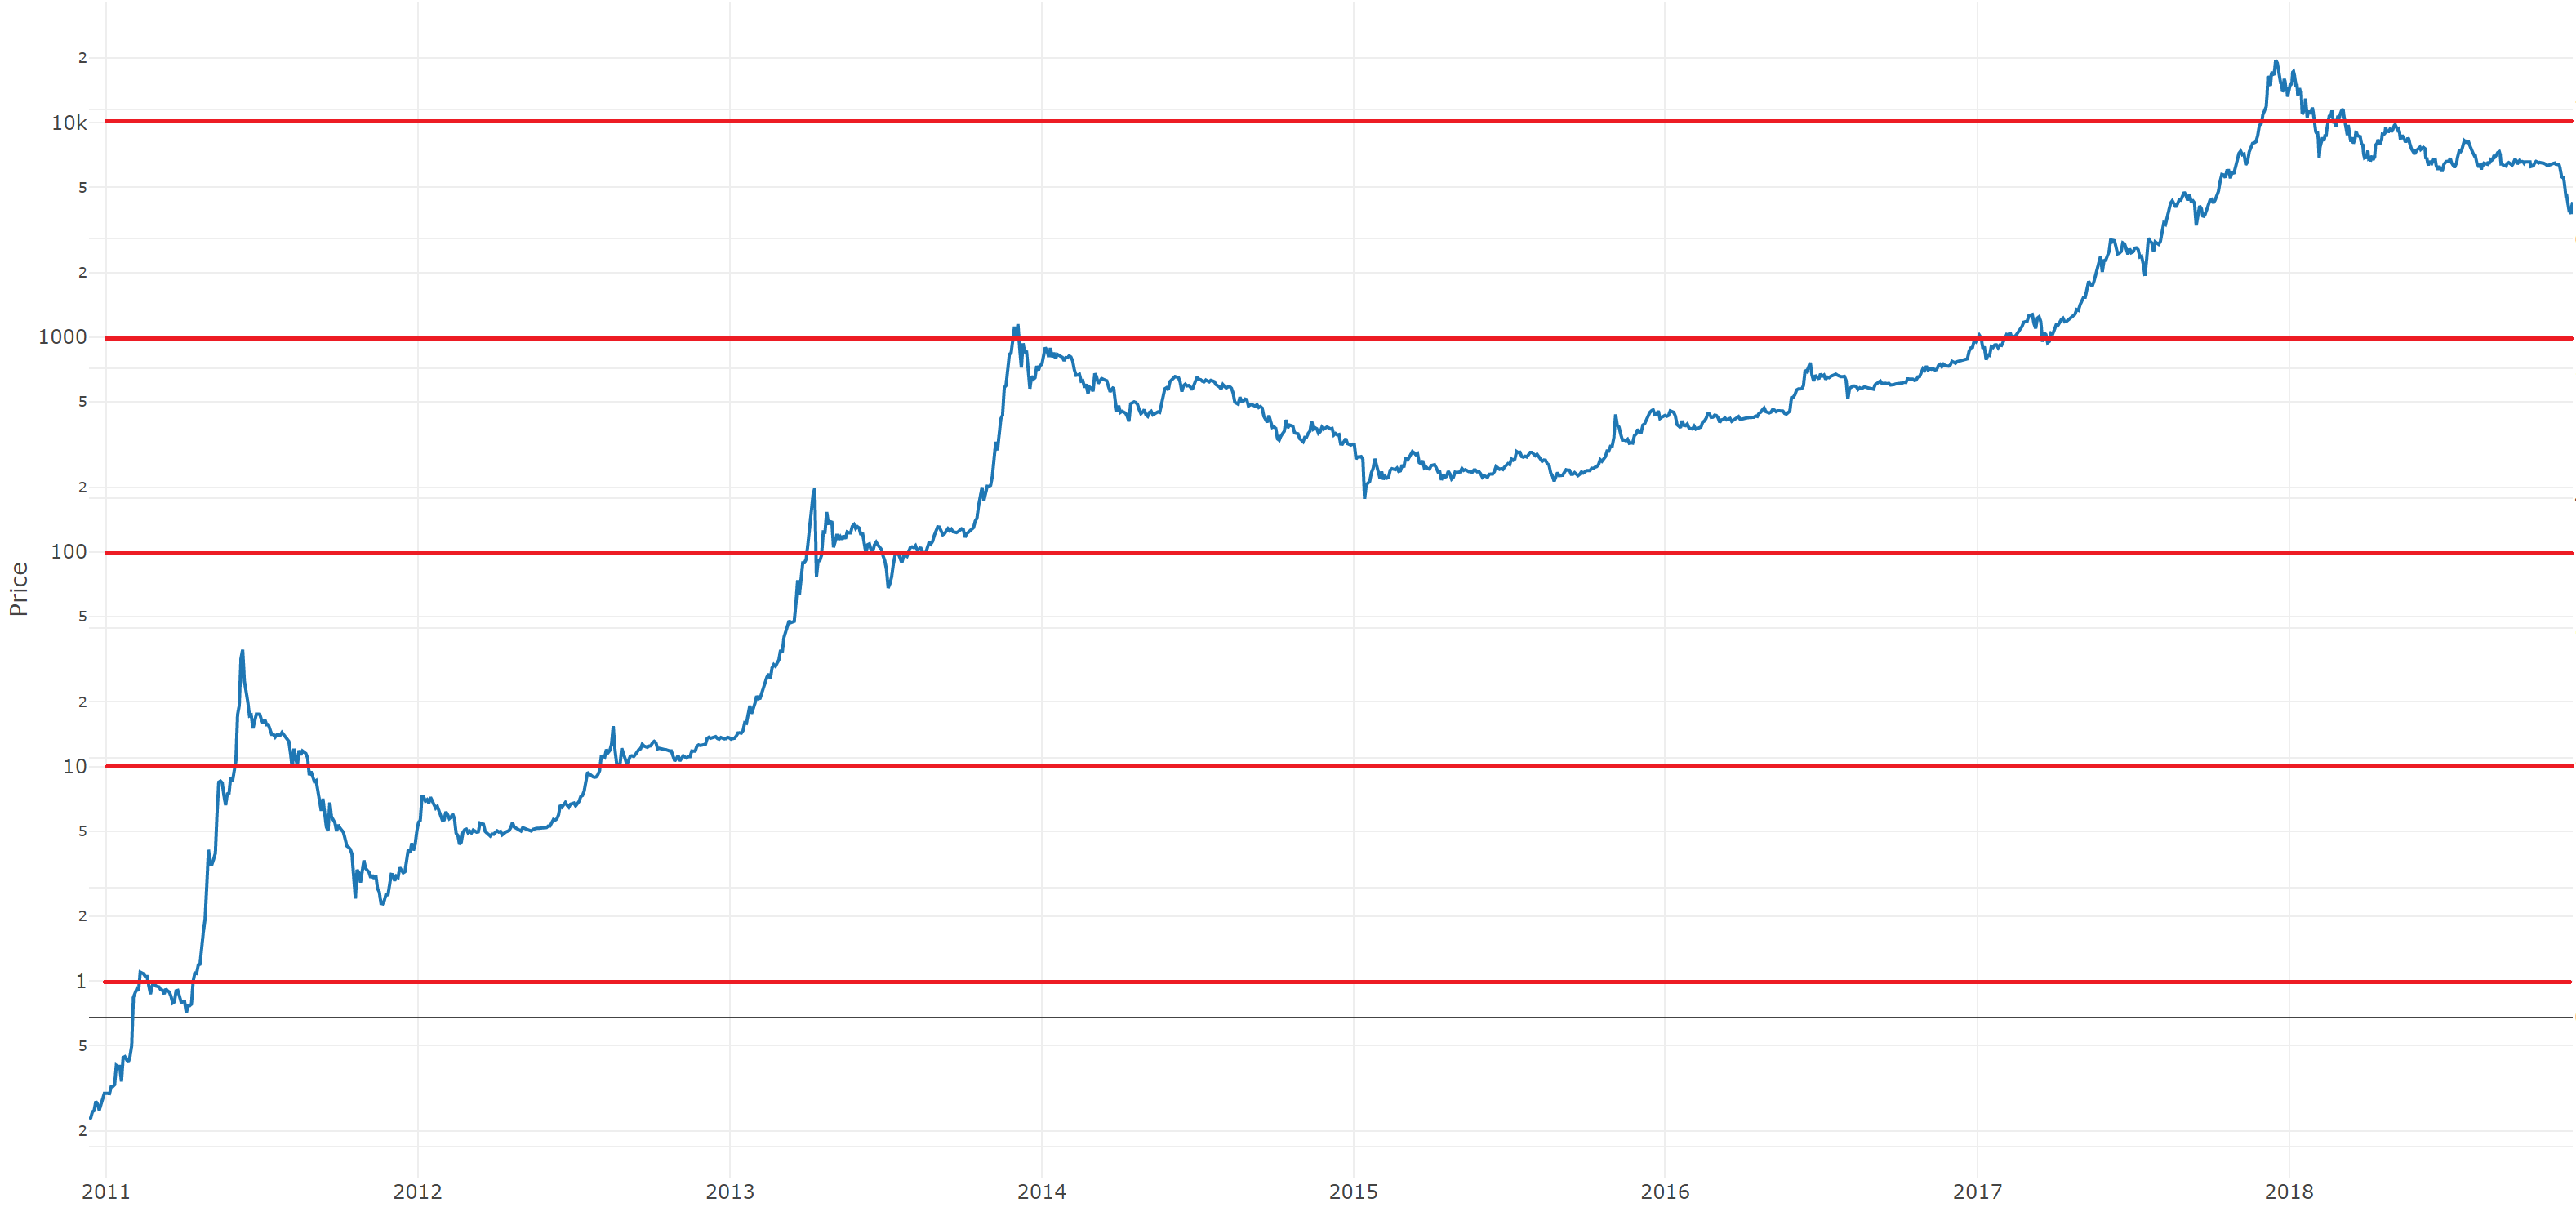
Let's see here. Bitcoin has increased in value by a factor of ten, five times now. And, unless I'm misreading the situation here, each time people get a little nervous about the new price and there's a pull back. Each time, the market sells off, then people relax and the process repeats. This almost looks like a pattern to me...
How you can benefit
If you've been reading my work, then you know that many people still look at Bitcoin's price in linear scale. To them, it seems like tulip mania. But, when you look at the data in log scale (as you should with emerging technology), a whole new perspective opens up to you. This unique angle can give you an edge in the market.
I'm not suggesting anything revolutionary, simply that the Bitcoin market is moving in a consistent direction, with patterns that seem to crop up over and over (the bubble cycle). Eventually, this will all be common knowledge. But, for now; thinking about Bitcoin in this way will put you miles ahead of the chart monkeys trying to calculate daily movements and treat Bitcoin like a stock, or fiat currency.
Bitcoin is something different and you have to think differently to understand it.
Author

Hans Hauge
Independent Analyst
A cryptocurrency entrepreneur, author and analyst; currently the opinion leader on cryptocurrency on Seeking Alpha.


