Making a case for 28% crash in Fantom price
- Fantom price is trading with a bearish bias, suggesting the continuation of a downtrend.
- FTM could break below the immediate support at $0.400 and confront the lower boundary of the chart pattern at $0.375 before heading to the supporting SMAs.
- A daily candlestick close above the 50-day SMA at $0.470 would invalidate the bearish thesis.

Fantom (FTM) price has been trading with a bearish bias since early February, recording lower highs and lower lows as the price consolidated within a descending parallel channel. Like the rest of the altcoins, FTM follows the bearish wave of Bitcoin (BTC) with monitoring resources showing that the king crypto’s price action has lost an essential technical support level.
Fantom price continues southward
Fantom price has been rallying south, a move that was reinvigorated after the 9-day Exponential Moving Average (EMA) was flipped from support to resistance on February 19. The descending channel further denotes the persisting downtrend for FTM. As long as the altcoin continues to trade within the confines of the technical formation a reversal seems unlikely.
Meanwhile, traders should expect overhead pressure from the 9-day EMA at $0.429 to push the Fantom price below the immediate support at $0.400. If sellers continue to dominate the markets, FTM could shatter the pattern’s lower limit at $0.375 and tag the 100-day Simple Moving Average (SMA) at $0.350.
In a dire case, where Bitcoin price continues to sell-off, investors can expect Fantom price to nosedive and tag the 200-day SMA at $0.290. In total, this move would constitute a 28% downswing and is likely where the sellers will give up control.
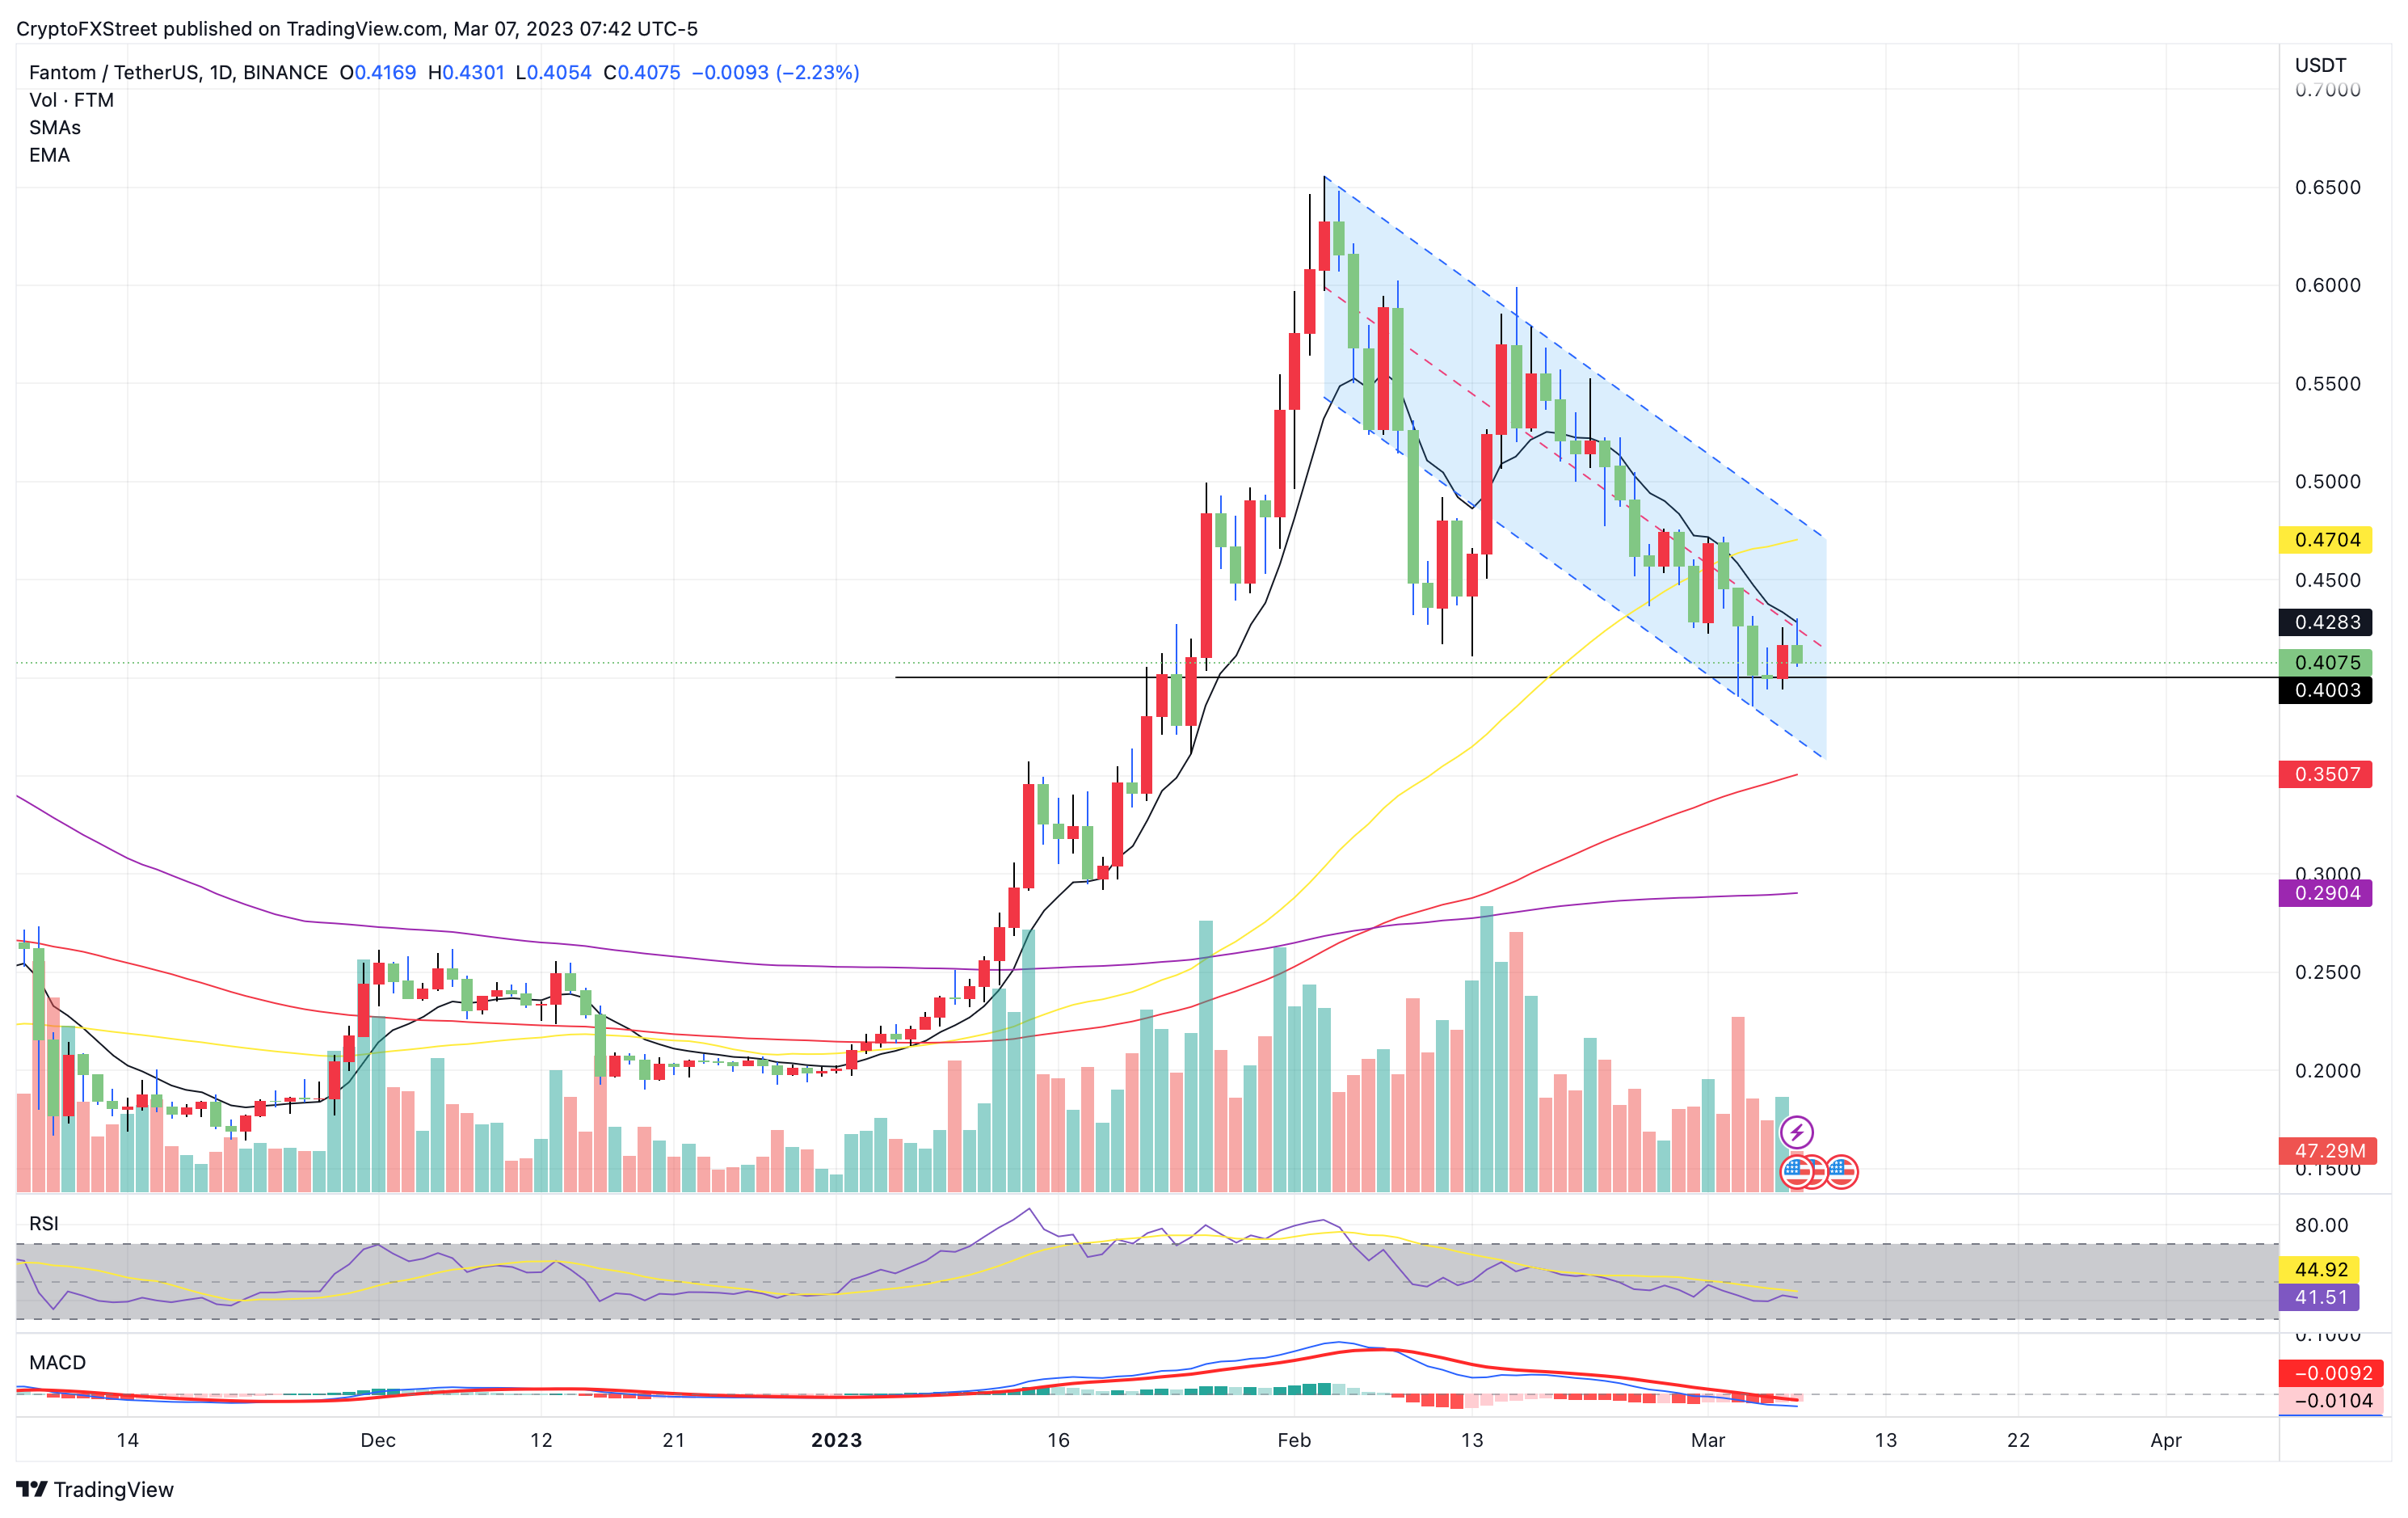
FTM/USDT 1-day chart
While all signs point to a continued downtrend, bulls should push to break above the 9-day EMA, embracing the midline of the chart pattern to forge a path northward. Additionally, a daily candlestick close in Fantom price above the 50-day SMA at $0.470 would invalidate the beairsh thesis explained above.
In such a case, Fantom price could propel 11% and tag the $0.523 resistance level.
Author

FXStreet Team
FXStreet


