LUNA price could revisit $5.5 as key indicator turns bearish
- Luna price is contained inside a right-angled broadening wedge pattern on the daily chart.
- The digital asset faces a robust resistance trendline as key indicator is close to presenting a sell signal.
- A breakout above a key resistance level will push the digital asset by 40%.

Luna price has just established a new all-time high at $9.35 but could be on the verge of a pullback after a significant rally in the past two months.
Luna price at risk of falling towards $5.5
On the daily chart, LUNA has established a right-angled broadening wedge pattern which is considered bearish. At the same time, the TD Sequential indicator has presented a green '8' candlestick which is usually followed by a sell signal.
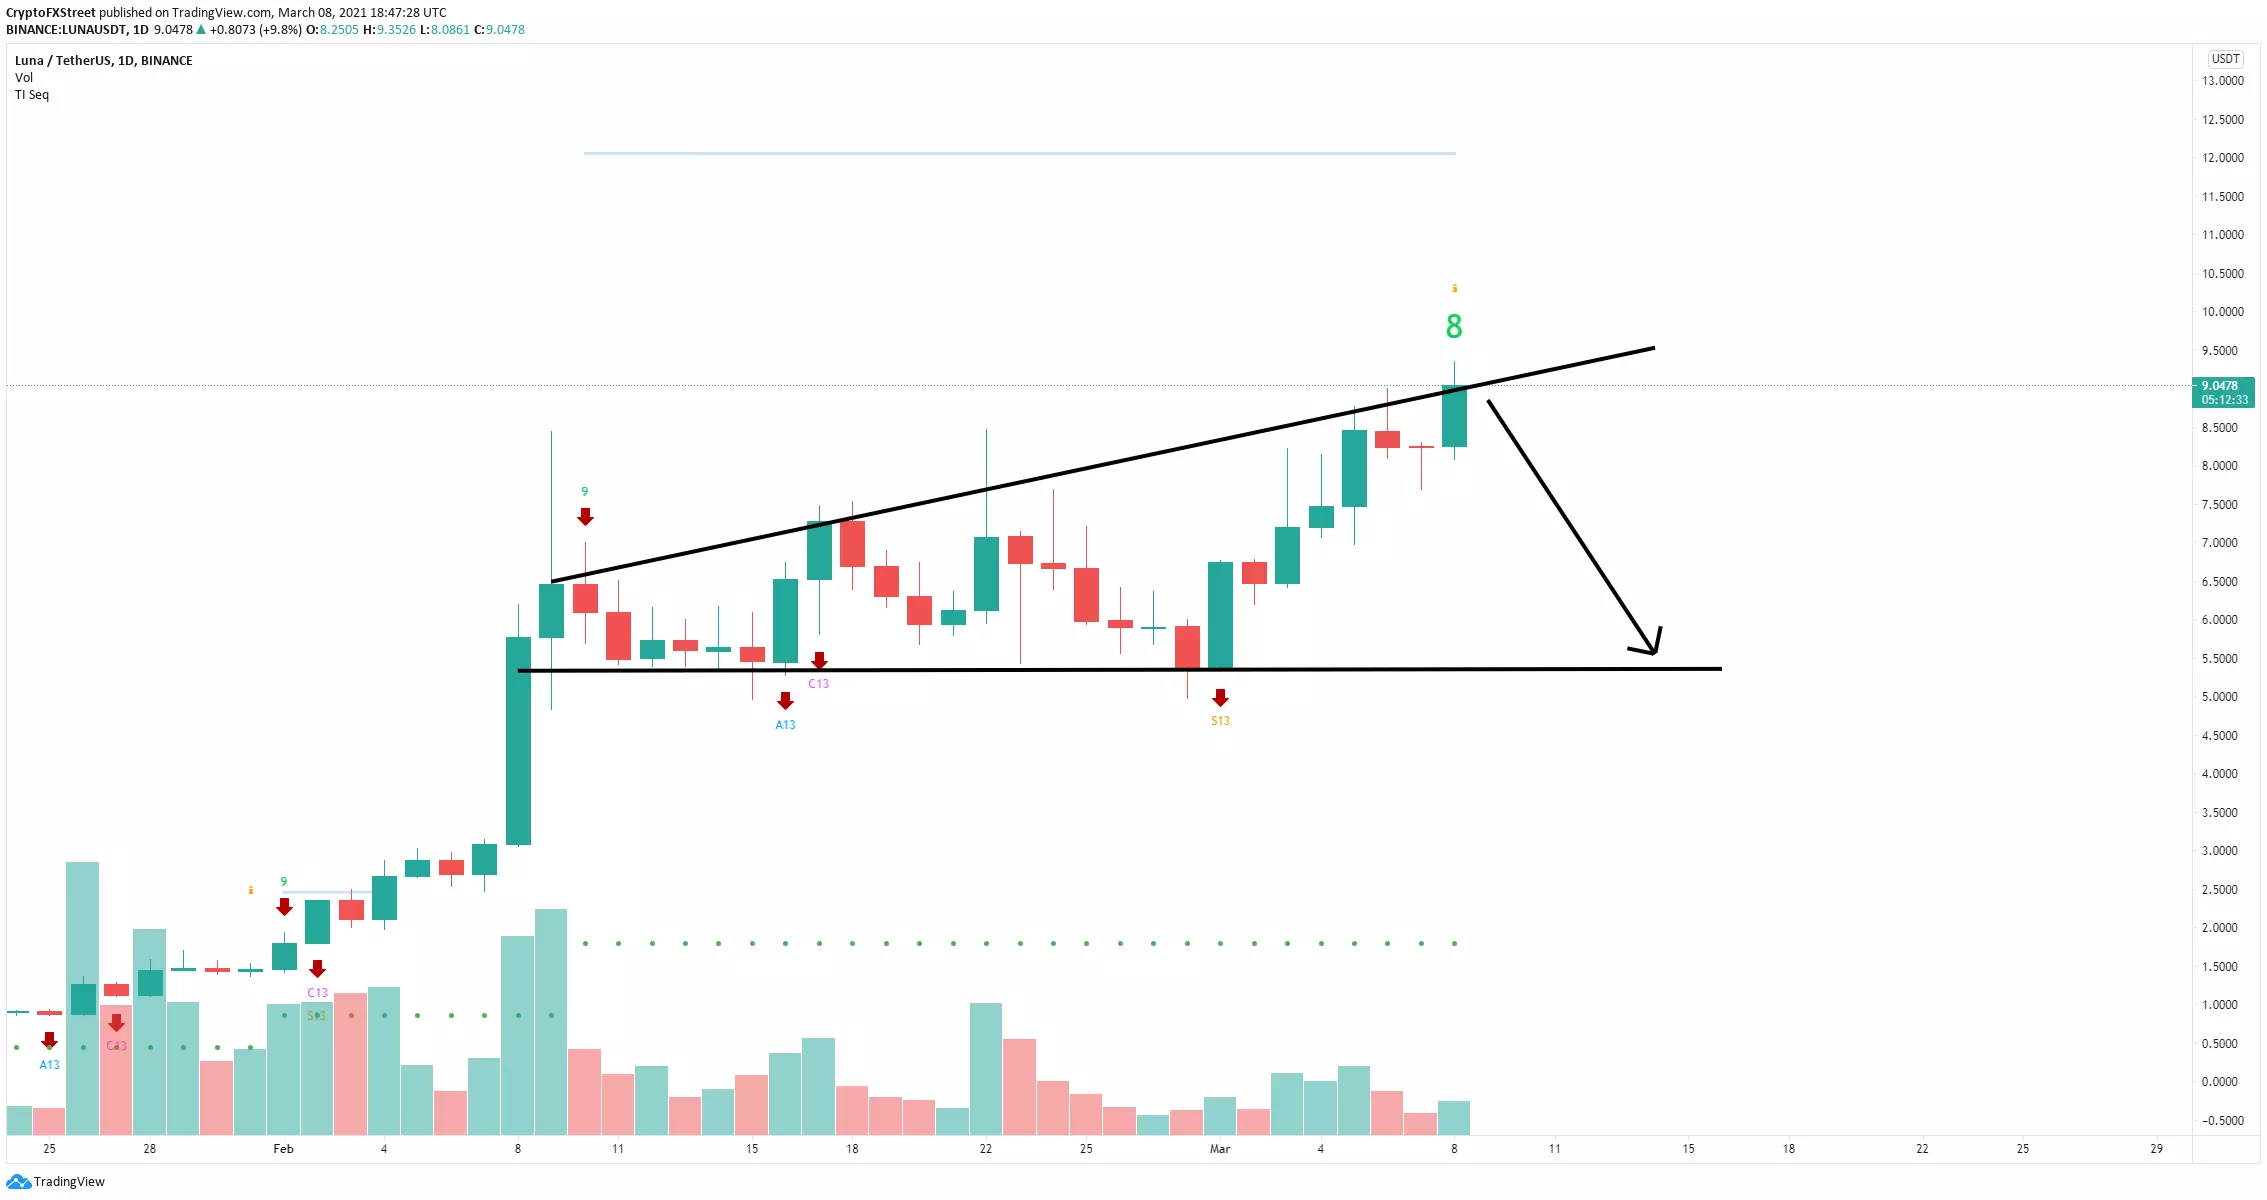
LUNA/USD daily chart
The confirmation of the sell signal has the potential to drive Luna price down to the lower trendline support located at $5.5.
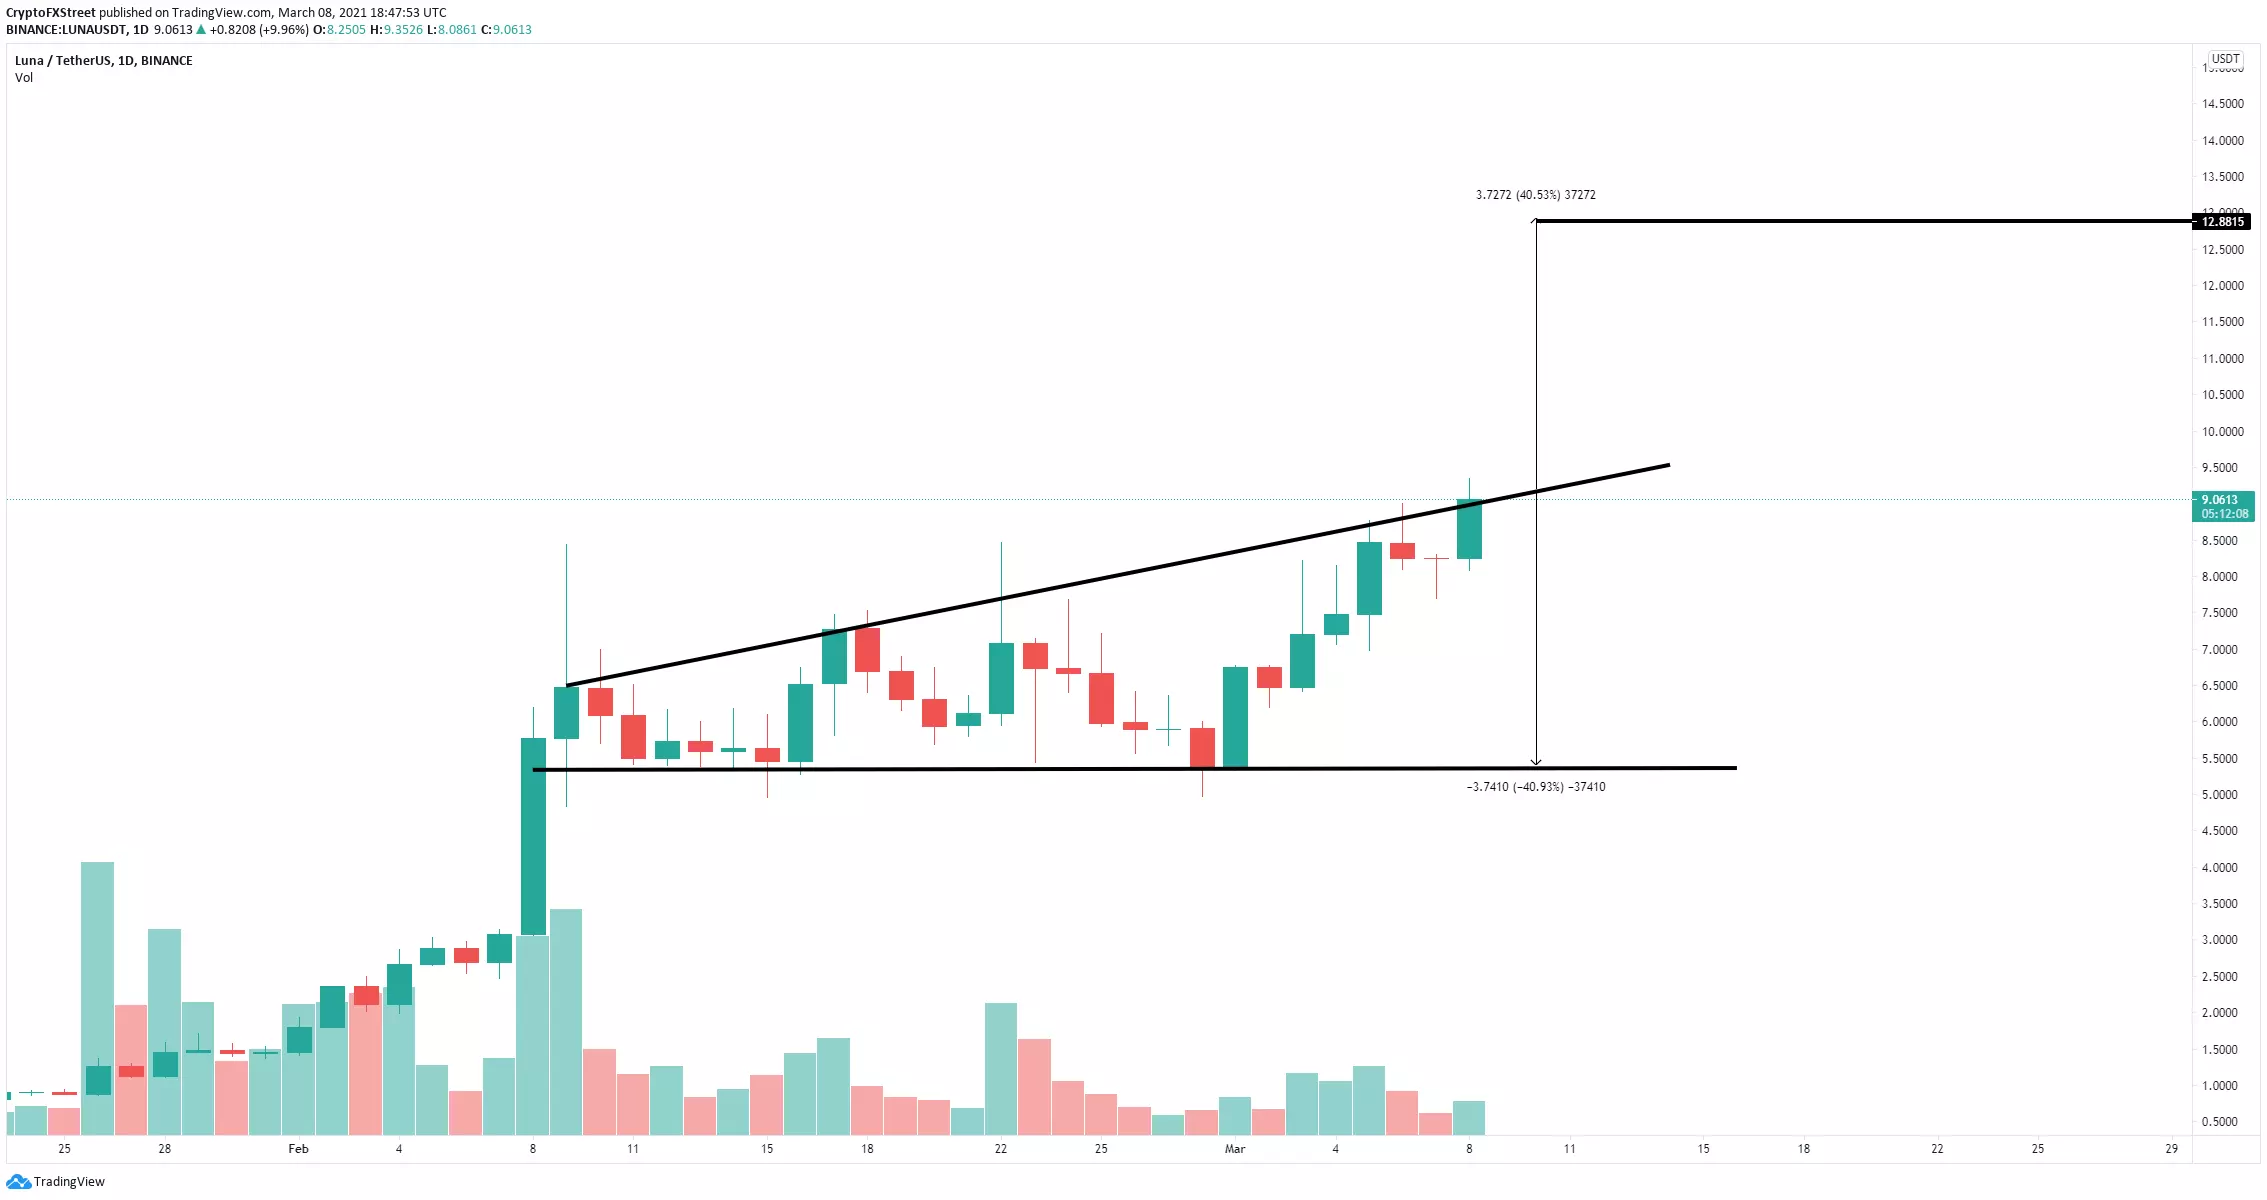
LUNA/USD daily chart
However, on the flip side, if the bulls can push LUNA above the upper resistance trendline and see a daily close there, the digital asset will explode by 40% in the long-term towards $13.
Author

Lorenzo Stroe
Independent Analyst
Lorenzo is an experienced Technical Analyst and Content Writer who has been working in the cryptocurrency industry since 2012. He also has a passion for trading.


