LTC/USD Daily Chart
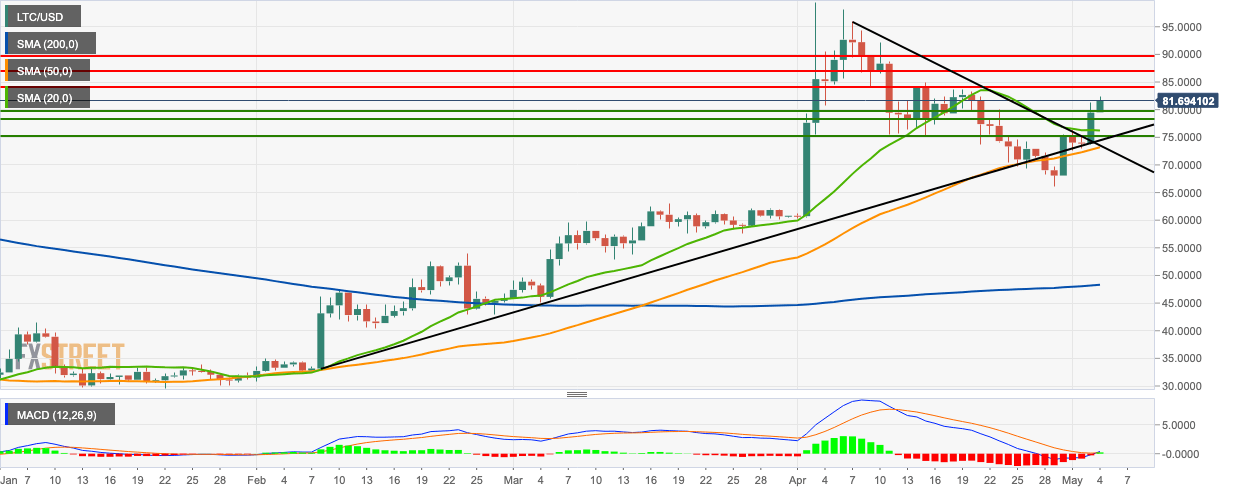
- The market has had a bullish breakout from a triangle formation.
- The two latest sessions have put the daily price above the SMA 200, SMA 50, and SMA 20 curves.
- The signal line has converged with the MACD line and the MACD indicator has finally had a bullish session after 22 consecutive bearish sessions.
- Bulls will need to negotiate resistance at $85, $87, and $90 to have any chance of taking the price back into the $100 zone.
LTC/USD 4-Hour Chart
- The 4-hour LTC/USD price chart had a bullish breakout from the green cloud of the Ichimoku indicator.
- The relative strength index (RSI) indicator is trending at 79.65.
- Since RSI is in the overbought zone, a bearish correction could be around the corner.
- Closest mid-term resistance lies at $85.
LTC/USD Hourly Chart
- LTC/USD bulls need to target short-term resistance at $85.
- The price still hasn’t reached the upper curve of the 20-day Bollinger band. This indicates that the upward movement isn’t as bullish as it could be.
- The squeeze of the Bollinger band shows decreasing market volatility.
- The hourly price is also trending above the SMA 200, SMA 50, and SMA 20 curves.
- The two latest sessions in the Elliot wave oscillator are bullish following nine consecutive bearish sessions.
Key Levels
Note: All information on this page is subject to change. The use of this website constitutes acceptance of our user agreement. Please read our privacy policy and legal disclaimer. Opinions expressed at FXstreet.com are those of the individual authors and do not necessarily represent the opinion of FXstreet.com or its management. Risk Disclosure: Trading foreign exchange on margin carries a high level of risk, and may not be suitable for all investors. The high degree of leverage can work against you as well as for you. Before deciding to invest in foreign exchange you should carefully consider your investment objectives, level of experience, and risk appetite. The possibility exists that you could sustain a loss of some or all of your initial investment and therefore you should not invest money that you cannot afford to lose. You should be aware of all the risks associated with foreign exchange trading, and seek advice from an independent financial advisor if you have any doubts.
Recommended Content
Editors’ Picks
Bitcoin stabilizes at crucial support after major crash
Bitcoin (BTC) trades slightly down on Thursday, after declining over 7% this week, and holds near a crucial support level; a sustained close below this threshold could signal further declines ahead.
Bitcoin history says Satoshi Nakamoto may have tested 51% attacks on the BTC blockchain
Bitcoin edges slightly lower on Thursday, consolidating this week’s sharp correction and trading close to the psychologically important $60,000 level. The crypto community has discussed the likelihood and impact of a 51% attack on the Bitcoin blockchain.
Shiba Inu and PEPE hold recent gains as Bitcoin hovers around $61,000
Bitcoin’s (BTC) price halts the decline and hovers around $61,000 at the time of writing on Thursday, after erasing recent gains and losing around 4.5% in the last seven days time frame.
BNB price is set for decline if it closes below key support level
Binance Coin price trades slightly higher at around $548 on Thursday after declining 0.88% the previous day. It is currently trading near key support, and a sustained close beneath this level could indicate further declines.
Bitcoin Weekly Forecast: $70,000 mark on sight as bulls remain strong
Bitcoin has risen around 3% so far this week, breaking above its range upper limit of $64,700. This gain was supported by increased institutional demand for ETFs, which recorded inflows of more than $612 million this week.
Five best Forex brokers in 2024
VERIFIED Choosing the best Forex broker in 2024 requires careful consideration of certain essential factors. With the wide array of options available, it is crucial to find a broker that aligns with your trading style, experience level, and financial goals.