LTCUSD formed a high at $134.08 on March 30, 2022 and since then it has dropped $23.44 registering a low of $110.64 on April 6, 2022. This translates into a 17.48% decline within a week. Today, we will look at why the rally from February 24, 2022 low stopped where it stopped and how our members were already knew the area and knew where sellers should be appearing. Let’s take a look at some charts of LTCUSD from members area at Elliottwave-Forecast.

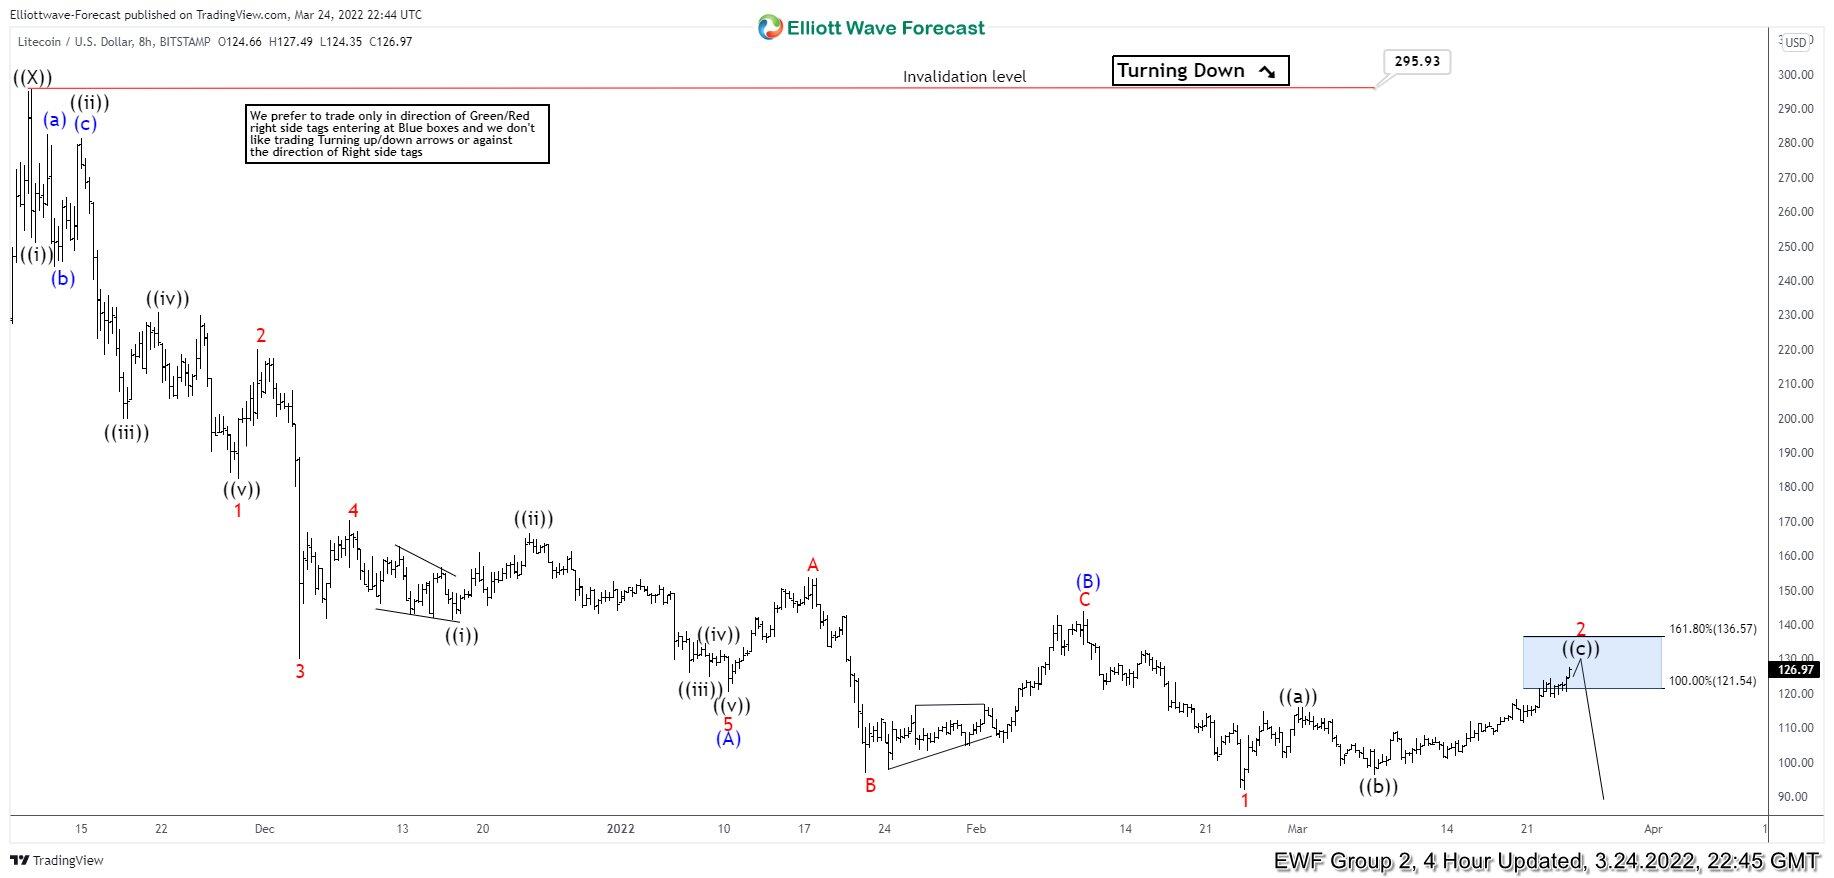
LTC/USD 4 hour Elliott Wave analysis – 24 March 2022

Chart below show pair formed a connector wave ((X)) at 295.93 on November 10, 2021. This was followed by a 5 waves impulsive decline to $120.49 reached on January 10, 2022. This was followed by a 3 waves bounce to $153.93 reached on January 17, 2022, then the cryptocurrency dropped to a new below $120.49 and reached a low of $96.85 on January 22, 2022. This drop to new low was in 3 waves and was followed by a sharp 5 waves rally to $144.13 reached on February 10, 2022. After this cryptocurrency resumed the decline and registered a new low at $91.74 on February 24, 2022. This decline was in 5 waves so we called the rally $144.13 as a 3-3-5 running FLAT Elliott wave correction  and labelled the drop to $91.74 as wave 1 of the new cycle lower.

LTCUSD started bouncing again with first leg of the bounce ending at $116 on March 1, 2022. This was followed by a pull back to $96.31 reached on March 7, 2022 and then it turned higher again. We highlighted $121.54 – $136.57 as 100 – 161.8% Fibonacci extension area with a blue box and as an area to complete wave 2 corrective bounce. Our members knew wave 2 should end in this area and sellers should appear to resume the decline while price stayed below 161.8% Fibonacci extension level at $136.57 or we should get 3 waves reaction lower at least.

LTCUSD

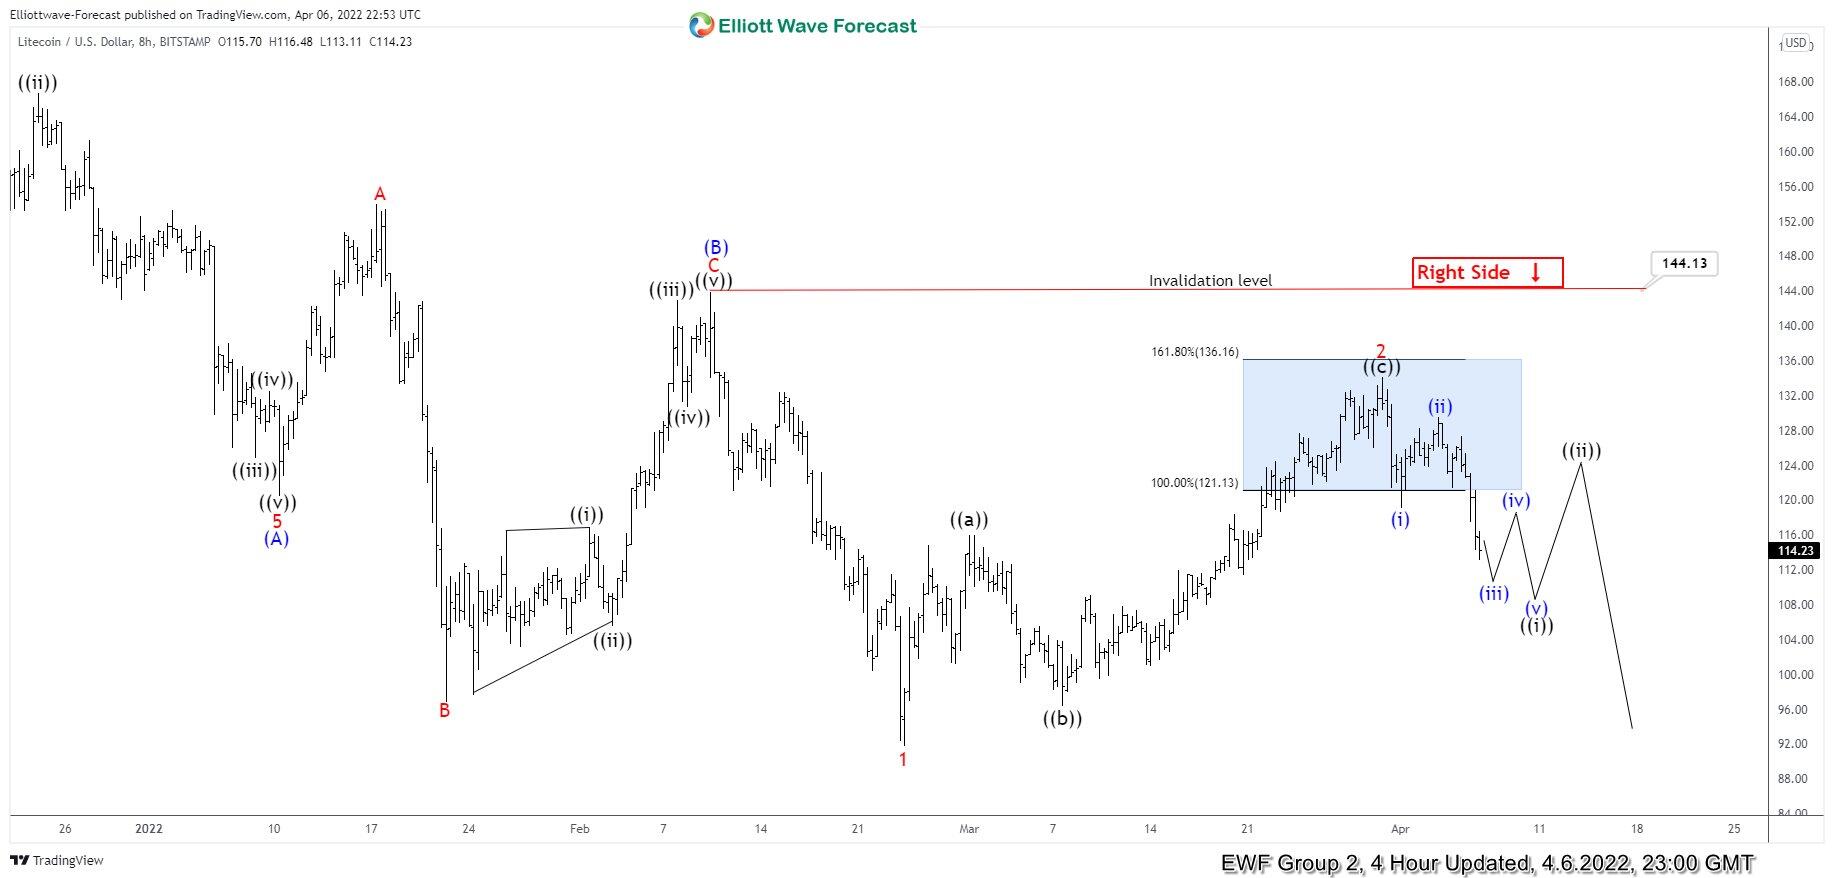
LTC/USD 4 hour Elliott Wave analysis – 6 April 2022

Chart below shows sellers did appear in the blue box area and cryptocurrency has turned lower. It has already reached 50% Fibonacci retracement of the rally from ((b)) wave low allowing sellers from blue box to get into a risk free position. Decline from $134.06 high is in 3 waves but while price stays below $129.50 high, it has scope to become 5 waves or 5 swings. Once it manages to complete 5 waves or 5 swings down from $134.06 high, that will add more conviction to the view that decline has resumed and we should get at least 1 more leg down against $134.06 high.

LTCUSD


FURTHER DISCLOSURES AND DISCLAIMER CONCERNING RISK, RESPONSIBILITY AND LIABILITY Trading in the Foreign Exchange market is a challenging opportunity where above average returns are available for educated and experienced investors who are willing to take above average risk. However, before deciding to participate in Foreign Exchange (FX) trading, you should carefully consider your investment objectives, level of xperience and risk appetite. Do not invest or trade capital you cannot afford to lose. EME PROCESSING AND CONSULTING, LLC, THEIR REPRESENTATIVES, AND ANYONE WORKING FOR OR WITHIN WWW.ELLIOTTWAVE- FORECAST.COM is not responsible for any loss from any form of distributed advice, signal, analysis, or content. Again, we fully DISCLOSE to the Subscriber base that the Service as a whole, the individual Parties, Representatives, or owners shall not be liable to any and all Subscribers for any losses or damages as a result of any action taken by the Subscriber from any trade idea or signal posted on the website(s) distributed through any form of social-media, email, the website, and/or any other electronic, written, verbal, or future form of communication . All analysis, trading signals, trading recommendations, all charts, communicated interpretations of the wave counts, and all content from any media form produced by www.Elliottwave-forecast.com and/or the Representatives are solely the opinions and best efforts of the respective author(s). In general Forex instruments are highly leveraged, and traders can lose some or all of their initial margin funds. All content provided by www.Elliottwave-forecast.com is expressed in good faith and is intended to help Subscribers succeed in the marketplace, but it is never guaranteed. There is no “holy grail” to trading or forecasting the market and we are wrong sometimes like everyone else. Please understand and accept the risk involved when making any trading and/or investment decision. UNDERSTAND that all the content we provide is protected through copyright of EME PROCESSING AND CONSULTING, LLC. It is illegal to disseminate in any form of communication any part or all of our proprietary information without specific authorization. UNDERSTAND that you also agree to not allow persons that are not PAID SUBSCRIBERS to view any of the content not released publicly. IF YOU ARE FOUND TO BE IN VIOLATION OF THESE RESTRICTIONS you or your firm (as the Subscriber) will be charged fully with no discount for one year subscription to our Premium Plus Plan at $1,799.88 for EACH person or firm who received any of our content illegally through the respected intermediary’s (Subscriber in violation of terms) channel(s) of communication.

Recommended content


Recommended Content

Editors’ Picks

Bitcoin Weekly Forecast: New all-time high at $78,900 looks feasible

Bitcoin Weekly Forecast: New all-time high at $78,900 looks feasible

Bitcoin price declines over 2% this week, but the bounce from a key technical level on the weekly chart signals chances of hitting a new all-time high in the short term. US spot Bitcoin ETFs posted $596 million in inflows until Thursday despite the increased profit-taking activity.

More Bitcoin News
XRP fails to recover even as Ripple files appeal in response to SEC's move

XRP fails to recover even as Ripple files appeal in response to SEC's move

Ripple price has been range bound between $0.5666 and $0.5068 since October 3. Over the past 20 days, XRP has traded within the range even as the SEC vs. Ripple lawsuit sees new developments. 

More Ripple News
Ethereum Price Forecast: ETH declines below $2,500 as demand fades

Ethereum Price Forecast: ETH declines below $2,500 as demand fades

Ethereum price is nearing its daily support level of $2,461; a firm close below this level would suggest a decline ahead. Coinbase Premium Index shows signs of weakness and remains below neutral levels.

More Ethereum News
Top 3 Price Prediction Bitcoin, Ethereum, Ripple: BTC shows signs of recovery

Top 3 Price Prediction Bitcoin, Ethereum, Ripple: BTC shows signs of recovery

Bitcoin has found support at the key $66,000 level, suggesting a potential recovery. However, Ethereum and Ripple prices are struggling below their critical support levels, indicating a possible continuation of their downtrends.

More Cryptocurrencies News
Bitcoin: New all-time high at $78,900 looks feasible

Bitcoin: New all-time high at $78,900 looks feasible

Bitcoin (BTC) trades slightly down at around $67,500 on Friday after finding support around the $66,000 level on Wednesday, following three consecutive days of decline earlier in the week.

Read full analysis
Best Forex Brokers with Low Spreads

Best Forex Brokers with Low Spreads

VERIFIED Low spreads are crucial for reducing trading costs. Explore top Forex brokers offering competitive spreads and high leverage. Compare options for EUR/USD, GBP/USD, USD/JPY, and Gold.

Read More

BTC

ETH

XRP