|

Litecoin Technical Analysis: LTC/USD takes a huge leap for the stars

  • Litecoin price on Wednesday makes a chunky jump of over 7% in the session. 
  • LTC/USD being cushioned near-term by an ascending trend line via the 15-minute chart view.
  • Near-term barrier within the $25 territory is proving to be a problem for greater upside.  

LTC/USD 15-minute chart
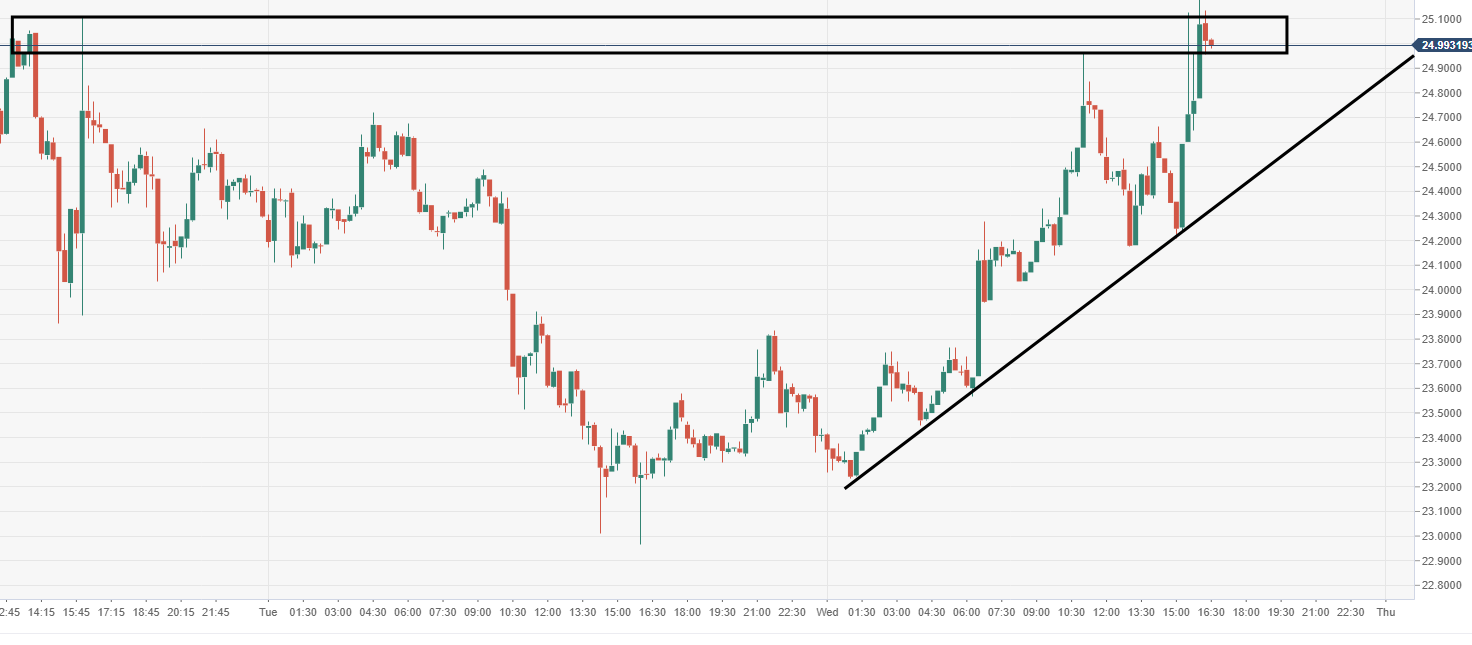


Spot rate:                  24.99

Relative change:      +7.27%

High:                         25.21

Low:                          23.23

Trend:                        Bearish

Support 1:                  24.40, ascending trend line.

Support 2:                  22.67, daily pivot point support.

Support 3:                  21.94, daily pivot point support.

Resistance 1:             25.00, near-term supply.

Resistance 2:             25.45, daily pivot point resistance.

Resistance 3:             26.18, daily pivot point resistance.

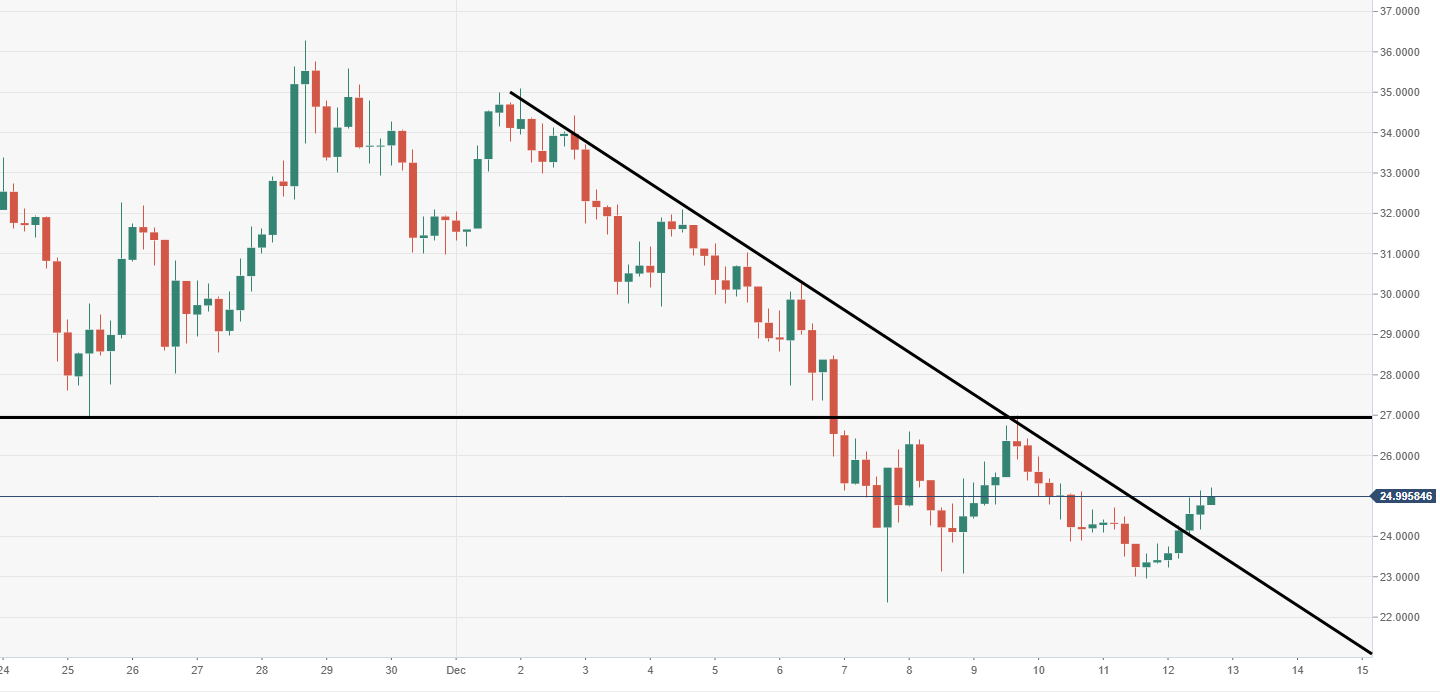
LTC/USD 4-hour chart

  • Bulls have managed to break above descending trend line, which was proving to be a tough line of resistance.
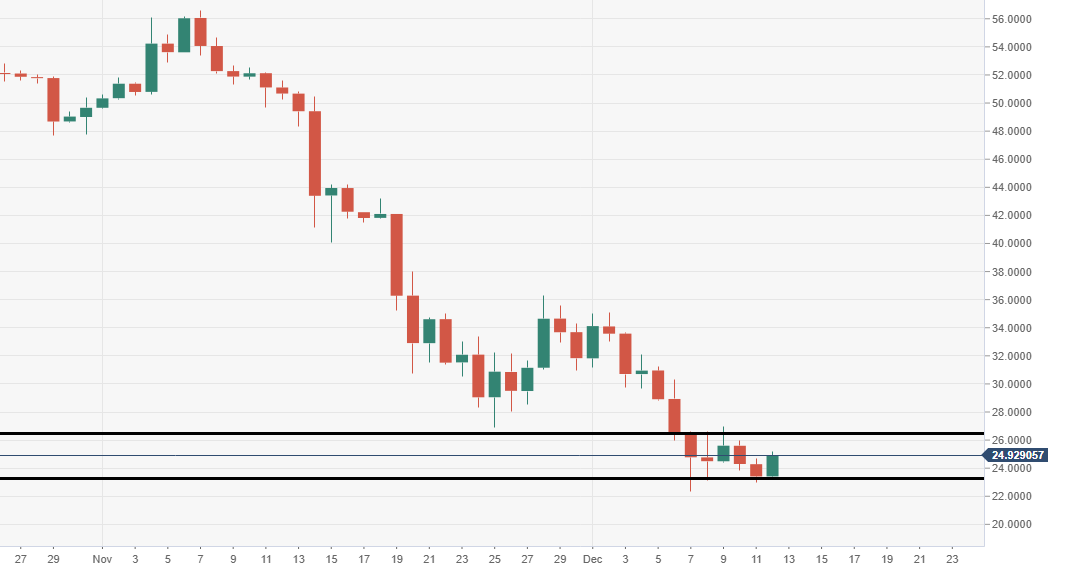
LTC/USD daily chart

  • Bulls heading for first daily close in the green so far this week. They mus break above $25-26 area for greater upside. 

Author

Ken Chigbo

Ken Chigbo

Independent Analyst

Ken has over 8 years exposure to the financial markets. He started his career as an analyst, covering a variety of asset classes; forex, fixed income, commodities and equities.

More from Ken Chigbo
Share:

Editor's Picks

Ripple bulls defend key support amid waning retail demand and ETF inflows

XRP ticks up above $1.40 support, but waning retail demand suggests caution. XRP attracts $4 million in spot ETF inflows on Thursday, signaling renewed institutional investor interest.

Crypto Today: Bitcoin, Ethereum, XRP rebound as risk appetite improves

Bitcoin rises marginally, nearing the immediate resistance of $68,000 at the time of writing on Friday. Major altcoins, including Ethereum and Ripple, hold key support levels as bulls aim to maintain marginal intraday gains.

Bitcoin Weekly Forecast: No recovery in sight 

Bitcoin price continues to trade sideways between $65,729 and $71,746, extending its consolidation since February 7. US-spot ETFs record an outflow of $403.90 million through Thursday, pointing to the fifth consecutive week of withdrawals.

Pi Network Price Forecast: PI recovery stalls amid profit-taking

Pi Network tests 50-day EMA support on Friday, after a 5% decline the previous day. PiScan data shows large deposits on CEXs totaling over 4 million PI tokens in the last 24 hours, reflecting an exodus of investors taking profits.

Bitcoin Price Annual Forecast: BTC holds long-term bullish structure heading into 2026

Bitcoin (BTC) is wrapping up 2025 as one of its most eventful years, defined by unprecedented institutional participation, major regulatory developments, and extreme price volatility.

Bitcoin: No recovery in sight

Bitcoin (BTC) price continues to trade within a range-bound zone, hovering around $67,000 at the time of writing on Friday, and falling slightly so far this week, with no signs of recovery.