Litecoin Technical Analysis: LTC/USD next stop possibly $20 territory
- Litecoin price down a whopping 11% on Monday, one of the standout under performers.
- LTC/USD trading around a vital area of support, $37-36, subject to another free-fall if breached.
- Next major support to the downside eyed within early $20 territory, where the price consolidated between May-June 2017.

LTC/USD weekly chart
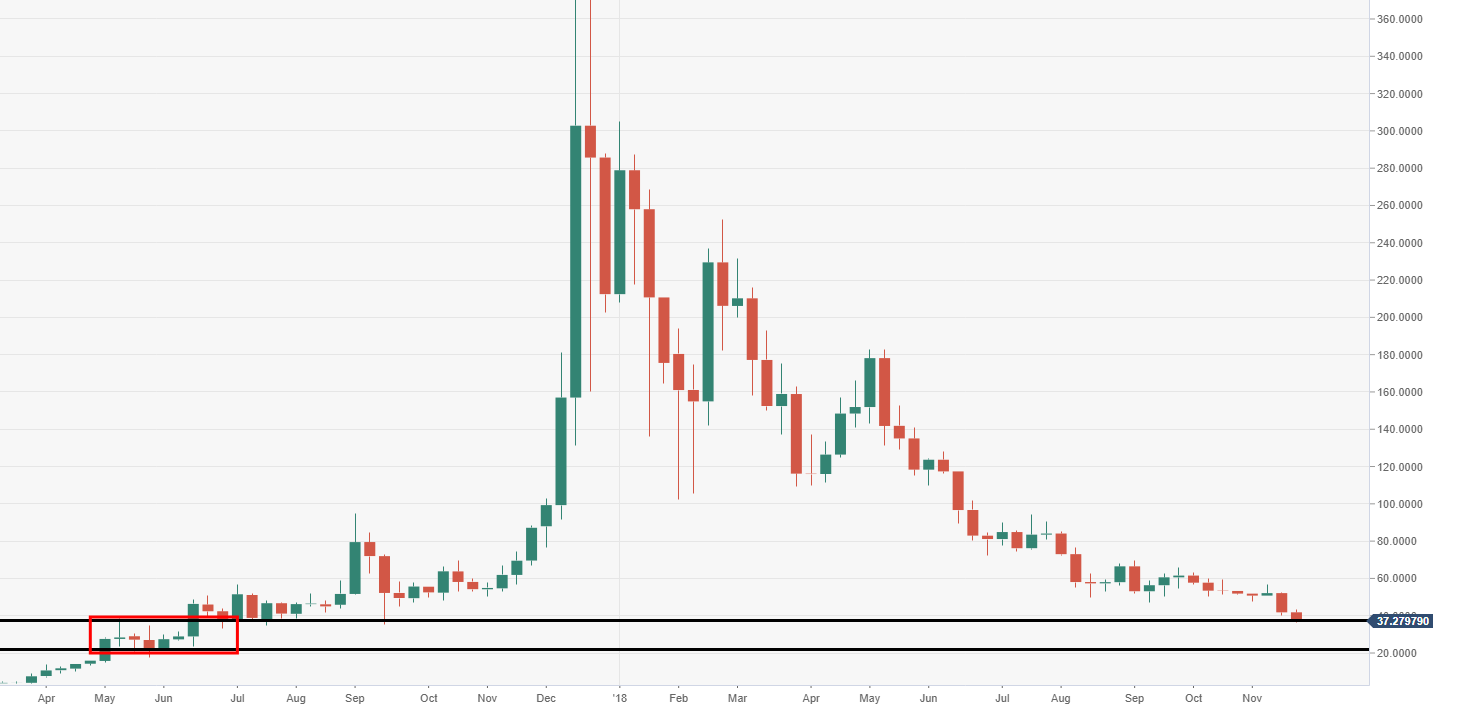
Spot rate: 37.27
Relative change: -11.90%
High: 42.11
Low: 36.33
Trend: Bearish
Support 1: 37-36.00, daily support area.
Support 2: 21.10, support during May-June 2017 consolidation.
Support 3: 15.72, last traded October 2017.
Resistance 1: 43.12, 18 November high.
Resistance 2: 44.13, daily resistance.
Resistance 3: 50.00, psychological resistance.
Author

Ken Chigbo
Independent Analyst
Ken has over 8 years exposure to the financial markets. He started his career as an analyst, covering a variety of asset classes; forex, fixed income, commodities and equities.


