Litecoin Technical Analysis: LTC/USD head and shoulders pattern in progress, here come the bears
- Litecoin price nursing losses on Friday in the late part of the session, down some 0.70%.
- LTC/USD has seen a breakout and retest of a head and shoulders pattern. The neckline has been breached, eyes on further potential downside.

LTC/USD 15-minute chart
- The price broke out to the downside from a rising wedge pattern formation.

Spot rate: 31.78
Relative change: -0.60%
High: 33.09
Low: 31.40
Trend: Bearish/Neutral
Support 1: 31.09, daily pivot point support.
Support 2: 30.15, daily pivot point support.
Support 3: 28.91, daily pivot point support.
Resistance 1: 33.27, daily pivot point resistance.
Resistance 2: 34.51, daily pivot point resistance.
Resistance 3: 35.45, daily pivot point resistance.
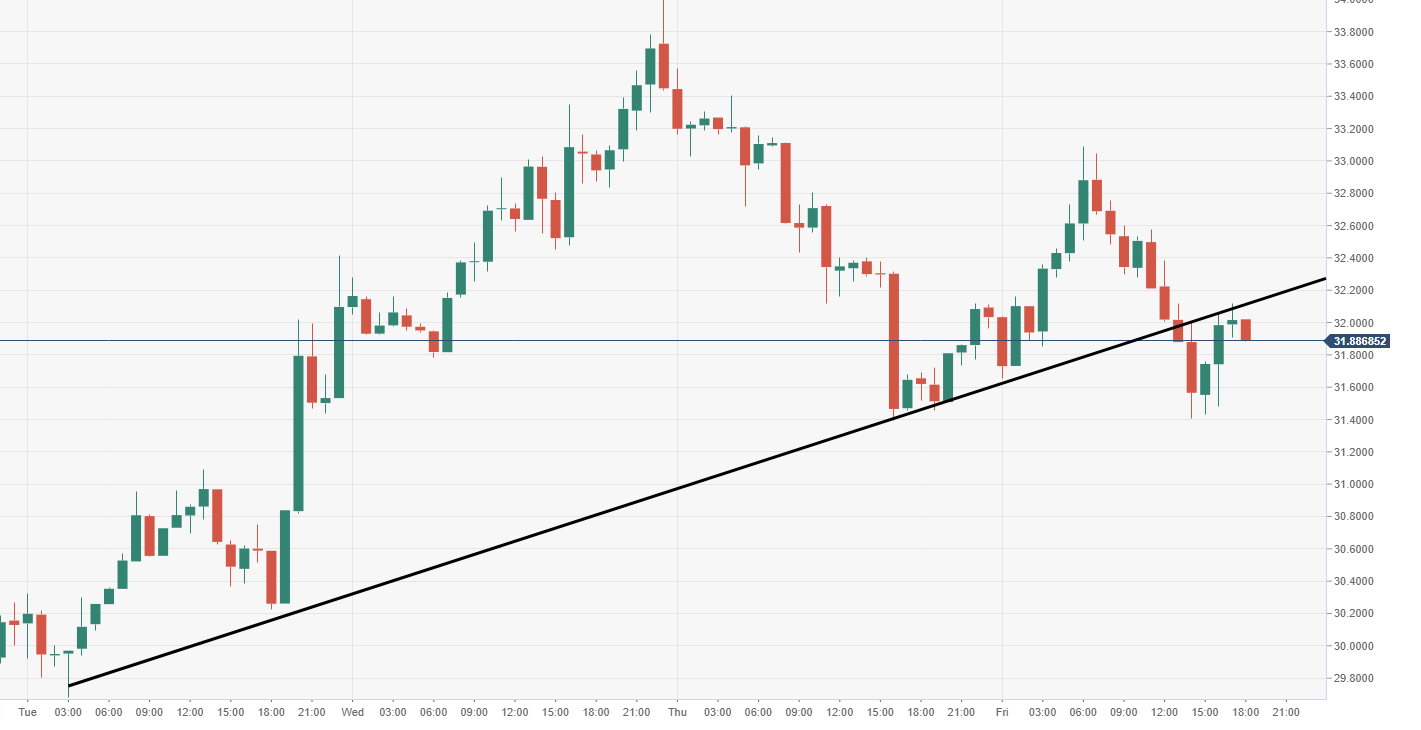
LTC/USD 60-minute chart
- A clearer view of the neckline break and retest. Price action has forms a bearish evening star candlestick.
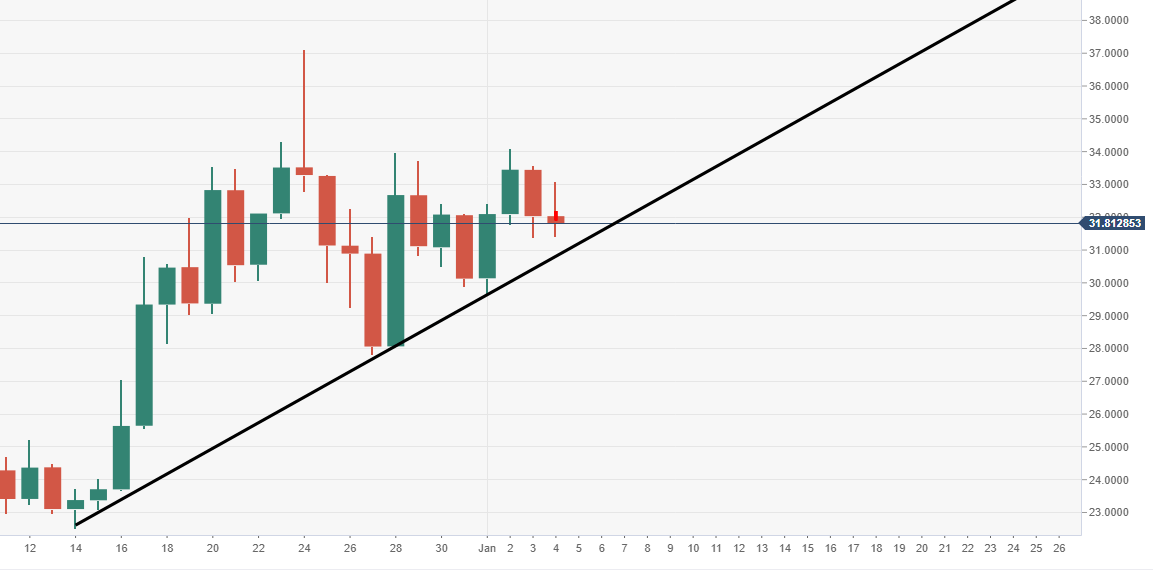
LTC/USD daily chart
- Price action is still very much supported by an ascending trend line via the daily.
Author

Ken Chigbo
Independent Analyst
Ken has over 8 years exposure to the financial markets. He started his career as an analyst, covering a variety of asset classes; forex, fixed income, commodities and equities.


