Litecoin Technical Analysis: LTC/USD head and shoulders of death
- Litecoin price trading down around 2% in the early part of Tuesday's session, price struggles to hold gains seen at the daily open.
- LTC/USD via the 60-minute chart view has formed a head and shoulders pattern, subject to a potential breakout south.
- Neckline of above-mentioned pattern seen at around $28.70, a breach could open the door for another chunky drop.

LTC/USD 60-minute chart
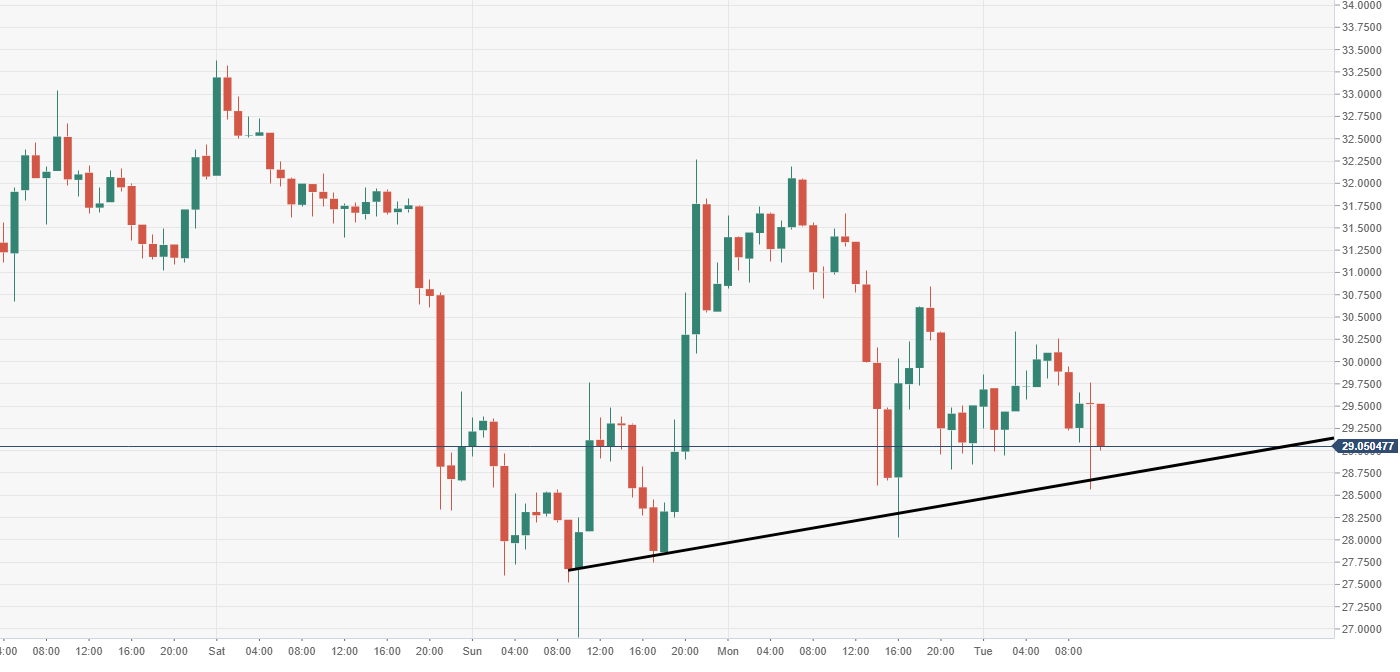
Spot rate: 29.01
Relative change: -2.20%
High: 30.34
Low: 28.58
Trend: Bearish
Support 1: 28.70, neckline of h & s pattern.
Support 2: 27.62, daily pivot point support.
Support 3: 25.74, daily pivot point support.
Resistance 1: 31.78, daily pivot point resistance.
Resistance 2: 34.06, neckline of double bottom.
Resistance 3: 35.94, daily pivot point resistance.
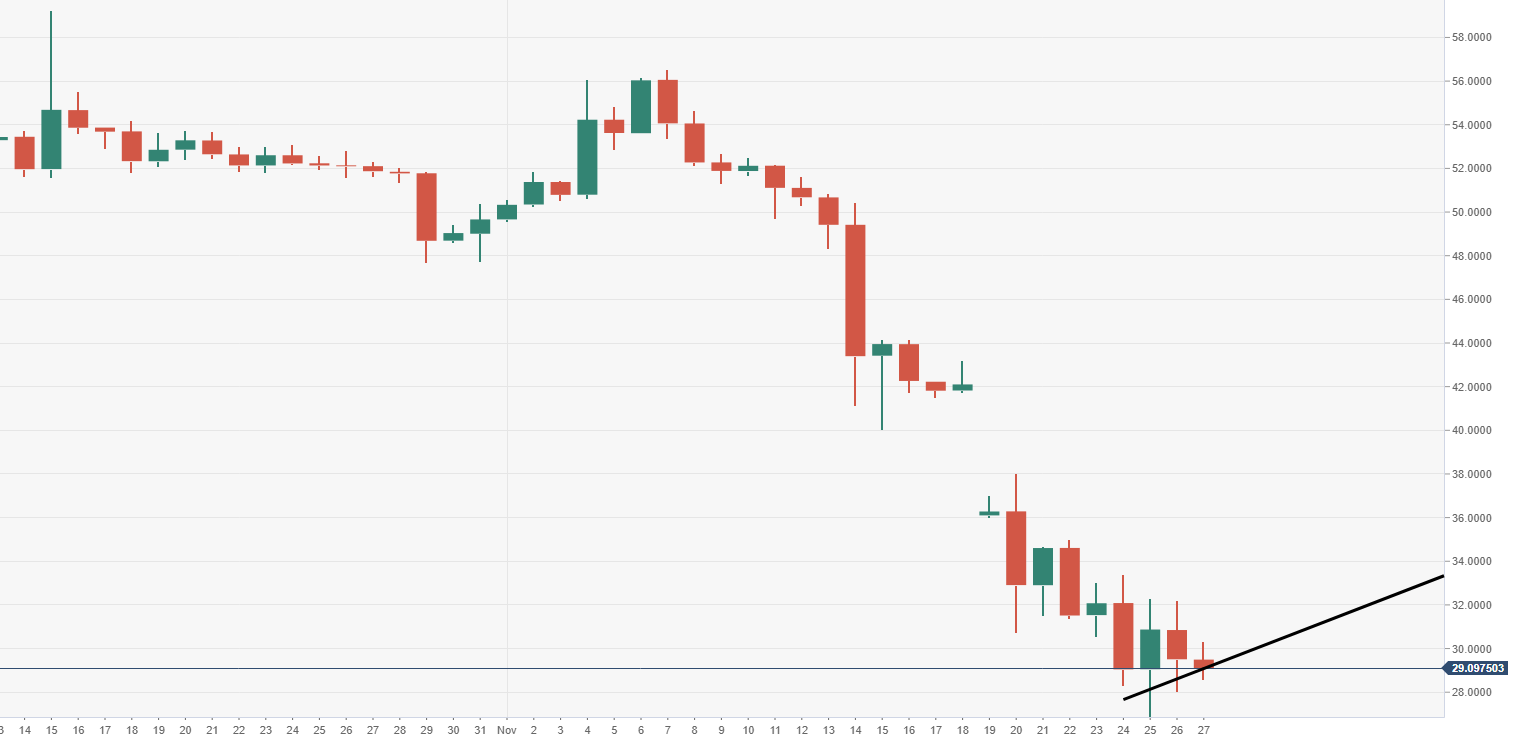
LTC/USD daily chart
- The bearish trend remains firm, as any daily session seen in the green, is the day after sold. Bulls are incapable of sustaining any upside momentum for now.
Author

Ken Chigbo
Independent Analyst
Ken has over 8 years exposure to the financial markets. He started his career as an analyst, covering a variety of asset classes; forex, fixed income, commodities and equities.


