Litecoin Technical Analysis: LTC/USD enjoying the Santa rally, next stop $50
- Litecoin price on Monday enjoying double-digit gains, up 10% into the second half.
- LTC/USD is supported by a near-term ascending trend line. Bulls eyes are on a reclaim of $50 within the near-term.

LTC/USD 15-minute chart
- Ascending trend line via the 15-minute chart view providing a safety net for the bulls.
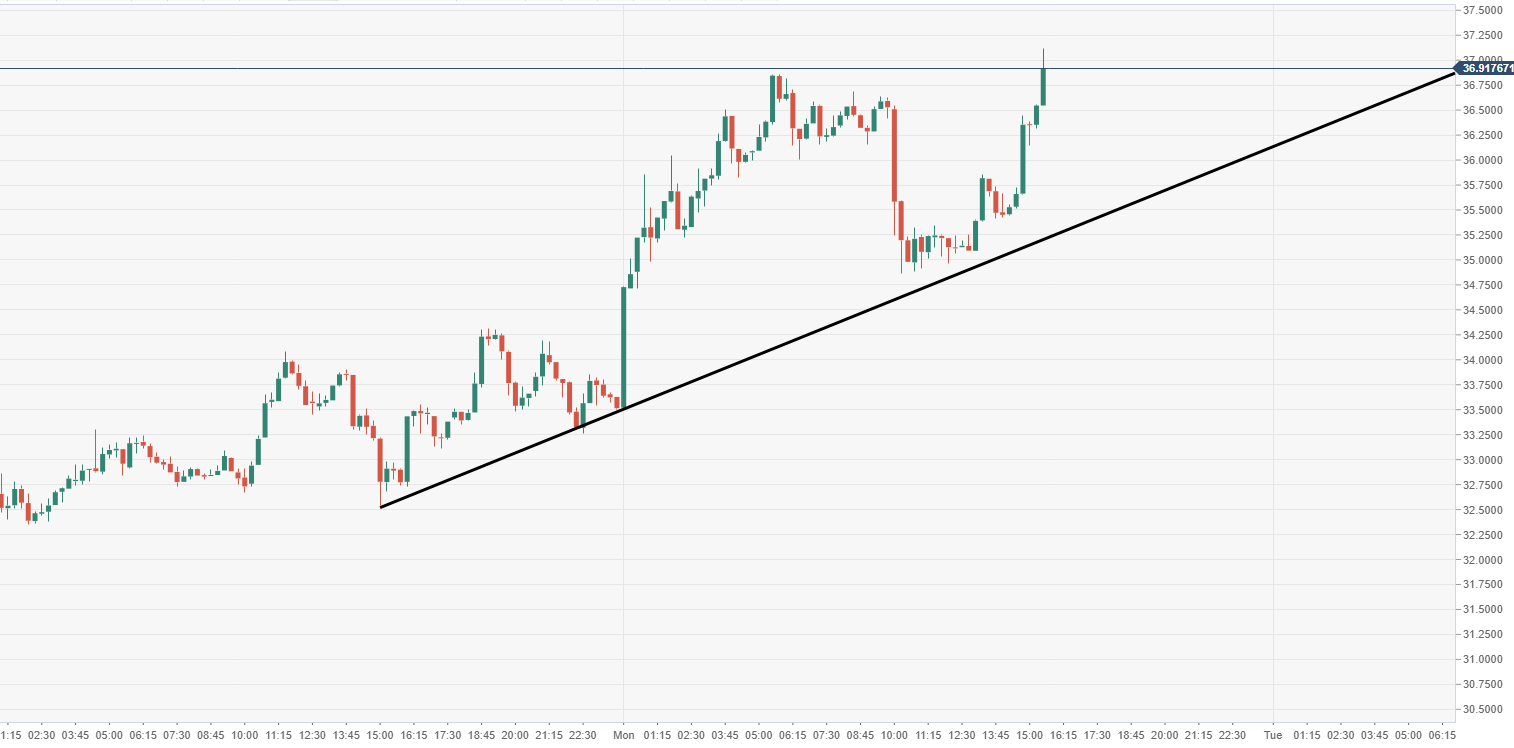
Spot rate: 36.75
Relative change: +9.41%
High: 37.12
Low: 33.50
Trend: Bullish
Resistance 1: 36.92, daily pivot point resistance.
Resistance 2: 38.35, 20th November high.
Resistance 3: 50.00, psychological level.
Support 1: 32.21, daily pivot point support.
Support 2: 30.90, daily pivot point support.
Support 3: 29.85, daily pivot point support.
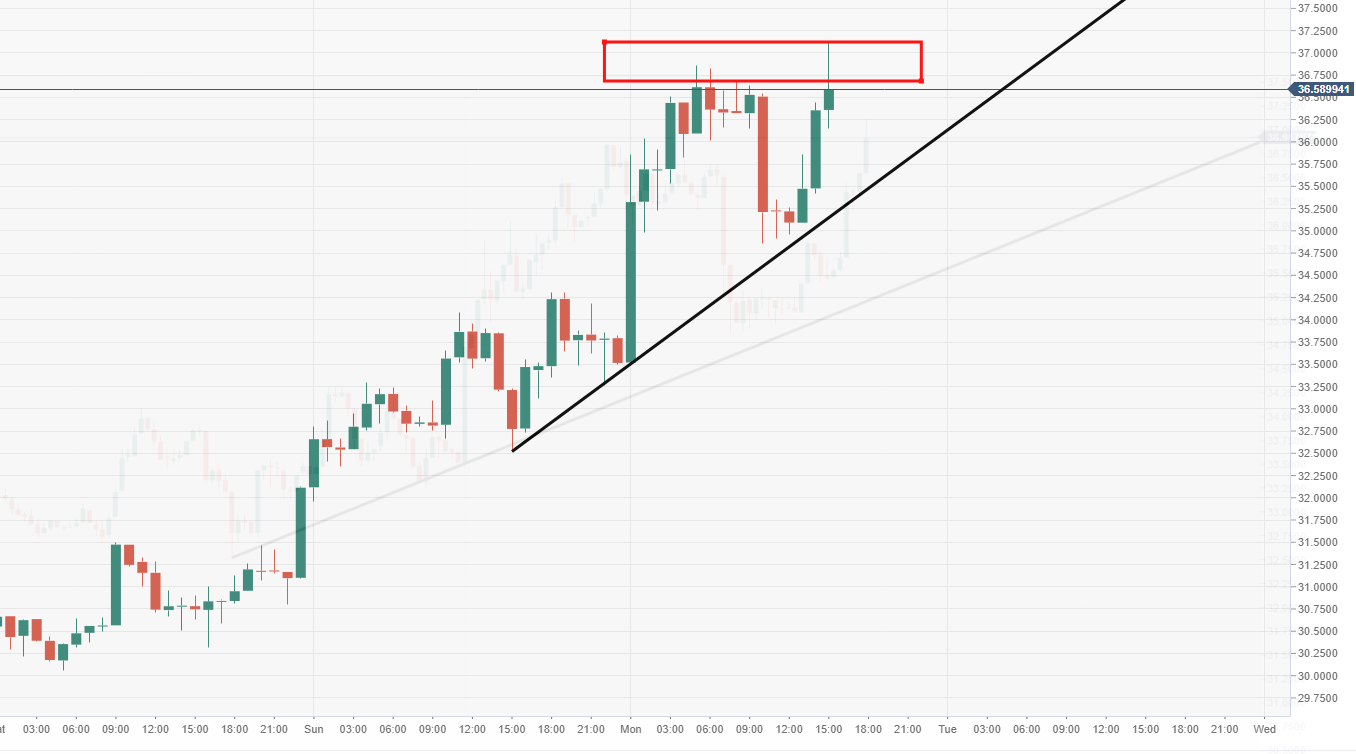
LTC/USD 60-minute chart
- Near-term supply zone proving to be a minor barrier for now, around $36.50-37.15.
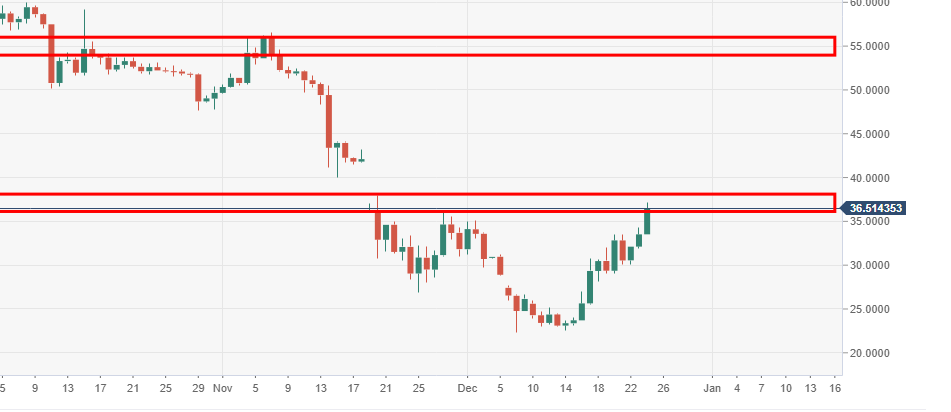
LTC/USD daily chart
- Next major area of interest for the bulls is seen up at $50-55 range, pre-November fall territory.
Author

Ken Chigbo
Independent Analyst
Ken has over 8 years exposure to the financial markets. He started his career as an analyst, covering a variety of asset classes; forex, fixed income, commodities and equities.


