Litecoin Technical Analysis: LTC/USD double-digit dancing for bulls
- Litecoin price storms ahead, holding big gains of around as much as 10% on Monday.
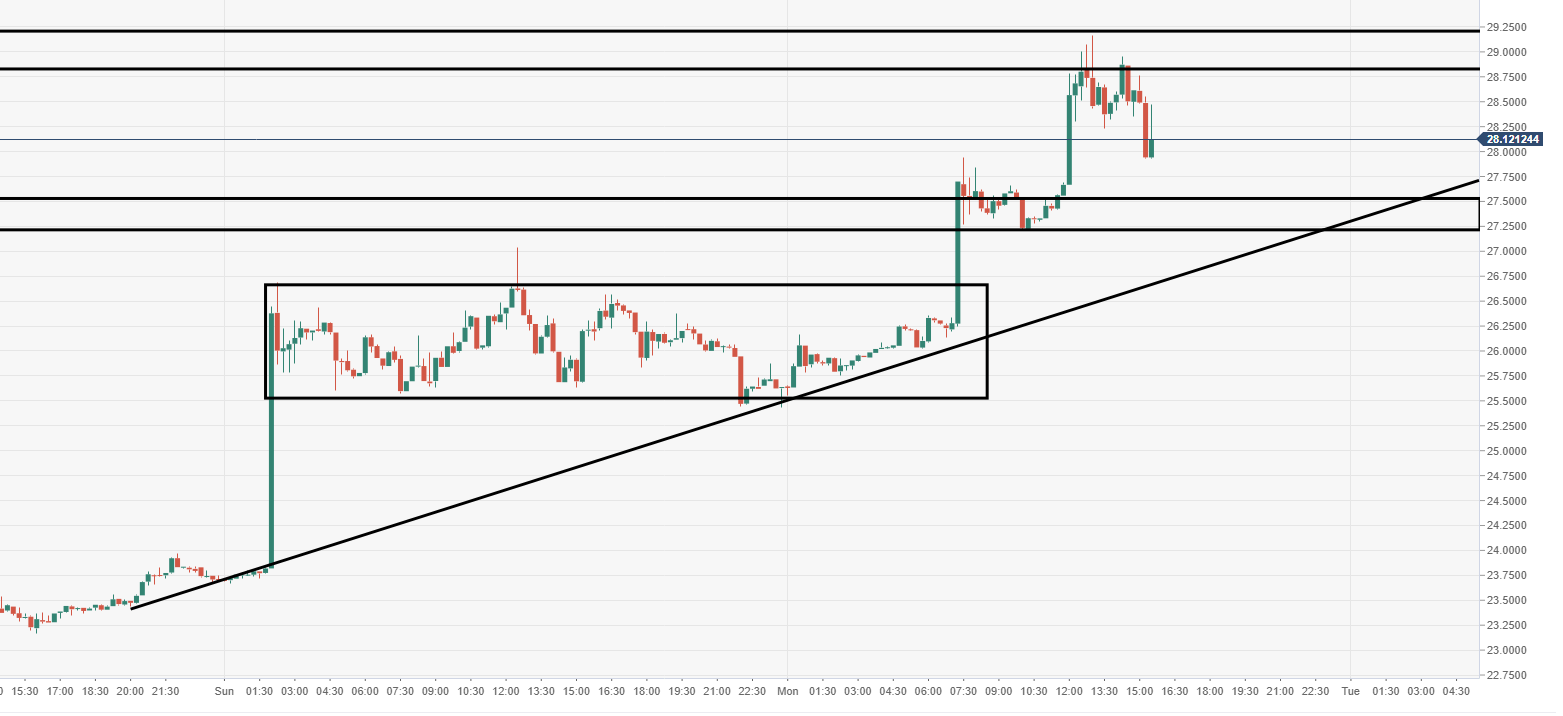
- LTC/USD bulls broke out from a range-block which had been containing the price near-term.
- Resistance is seen heading into the $30 mark, around the $29 territory.

LTC/USD 15-minute chart

Spot rate: 28.05
Relative change: +10.05%
High: 29.16
Low: 25.54
Trend: Bullish
Resistance 1: 28.82, daily pivot point support.
Resistance 2: 29.00, near-term supply area.
Resistance 3: 30.60, 7 December high.
Support 1: 23.85, daily pivot point support.
Support 2: 22.07, daily pivot point support.
Support 3: 20.48, daily pivot point support.
LTC/USD 60-minute chart
- Bulls see minor retreat, after running into near-term supply. Demand eyed just below at $25.50.
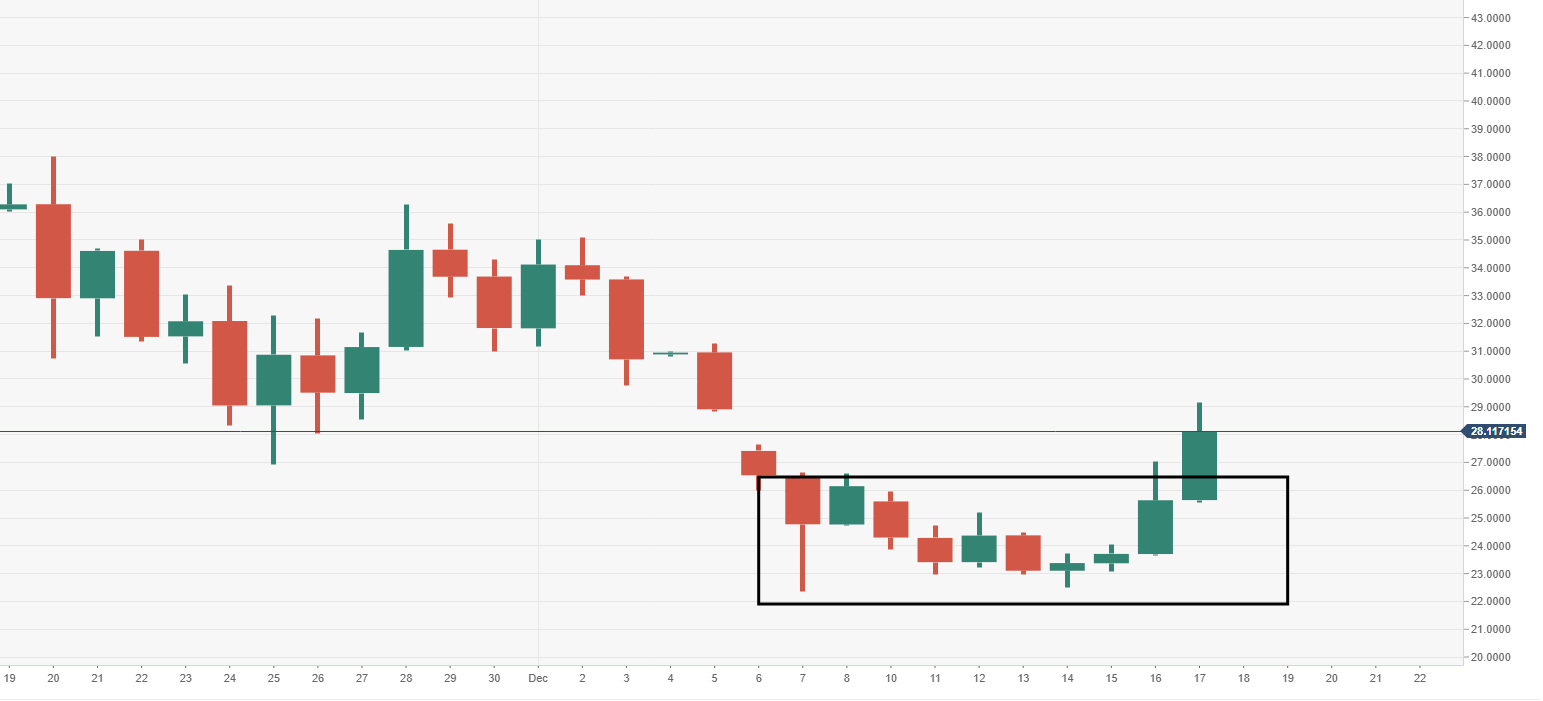
LTC/USD daily chart
- Bulls are enjoying four consecutive sessions in the green, on the road to recovery.
Author

Ken Chigbo
Independent Analyst
Ken has over 8 years exposure to the financial markets. He started his career as an analyst, covering a variety of asset classes; forex, fixed income, commodities and equities.


