Litecoin Technical Analysis: LTC/USD bounces off channel support, rendezvous at $50
- Litecoin is trading between the 50-day SMA support and the 200-day SMA resistance.
- LTC/USD has a positive technical picture despite the stalling below $50.

Litecoin advanced higher from the main support at $40 in tandem with the other major cryptocurrencies such as Bitcoin and Ethereum. Bitcoin ascended to highs above $10,400 on Monday while Ethereum stepped above $250. LTC/USD closed in on the psychological level at $50 but the upside is still limited by the 200-day SMA.
LTC/USD is teetering at $48.52 after gains towards $50 lost momentum. On the downside, the 50-day SMA is in line to offer support, marginally above channel support. This channel support was instrumental to the price action since the drop to $25 in March.
Applied technical indicators put emphasis on buyers being in control. For instance, the RSI is gradually approaching the overbought region. On the other hand, the MACD is moving higher inside the positive territory. In addition to that, a bullish divergence from the MACD hints that buyers would remain in the driver’s seat a while longer. The biggest short term milestone for the bulls would be to take down the seller congestion at $50. With the $50 in the rearview, gains towards $100 would start to materialize.
LTC/USD daily chart
 (6)-637266694413114951.png)
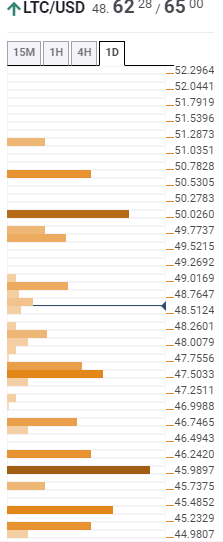
Litecoin confluence support and resistance levels
Resistance one: $49.01 – Highlighted by the previous high 4-hour, the Bollinger Band 15-mins upper and the previous high one-day.
Resistance two: $50.02 – Home to the SMA 200 one-day and the previous month high.
Support one: $47.50 – Highlighted by the pivot point one-week resistance two and the Bollinger Band one-day upper.
Support two: $45.98 – This region hosts the Fibonacci 61.8% one-month and the pivot point one-week resistance one.
Author

John Isige
FXStreet
John Isige is a seasoned cryptocurrency journalist and markets analyst committed to delivering high-quality, actionable insights tailored to traders, investors, and crypto enthusiasts. He enjoys deep dives into emerging Web3 tren


