Litecoin Technical Analysis: LTC/USD big daily rejection
- Litecoin was trading down chunky 5.5% in the latter stages of Friday's session.
- LTC/USD price dealt a big rejection on the daily, by descending trend line.
- Given mentioned rejection, price is heading to test the recently formed bottom area. Key support around the $27 mark.

LTC/USD daily chart
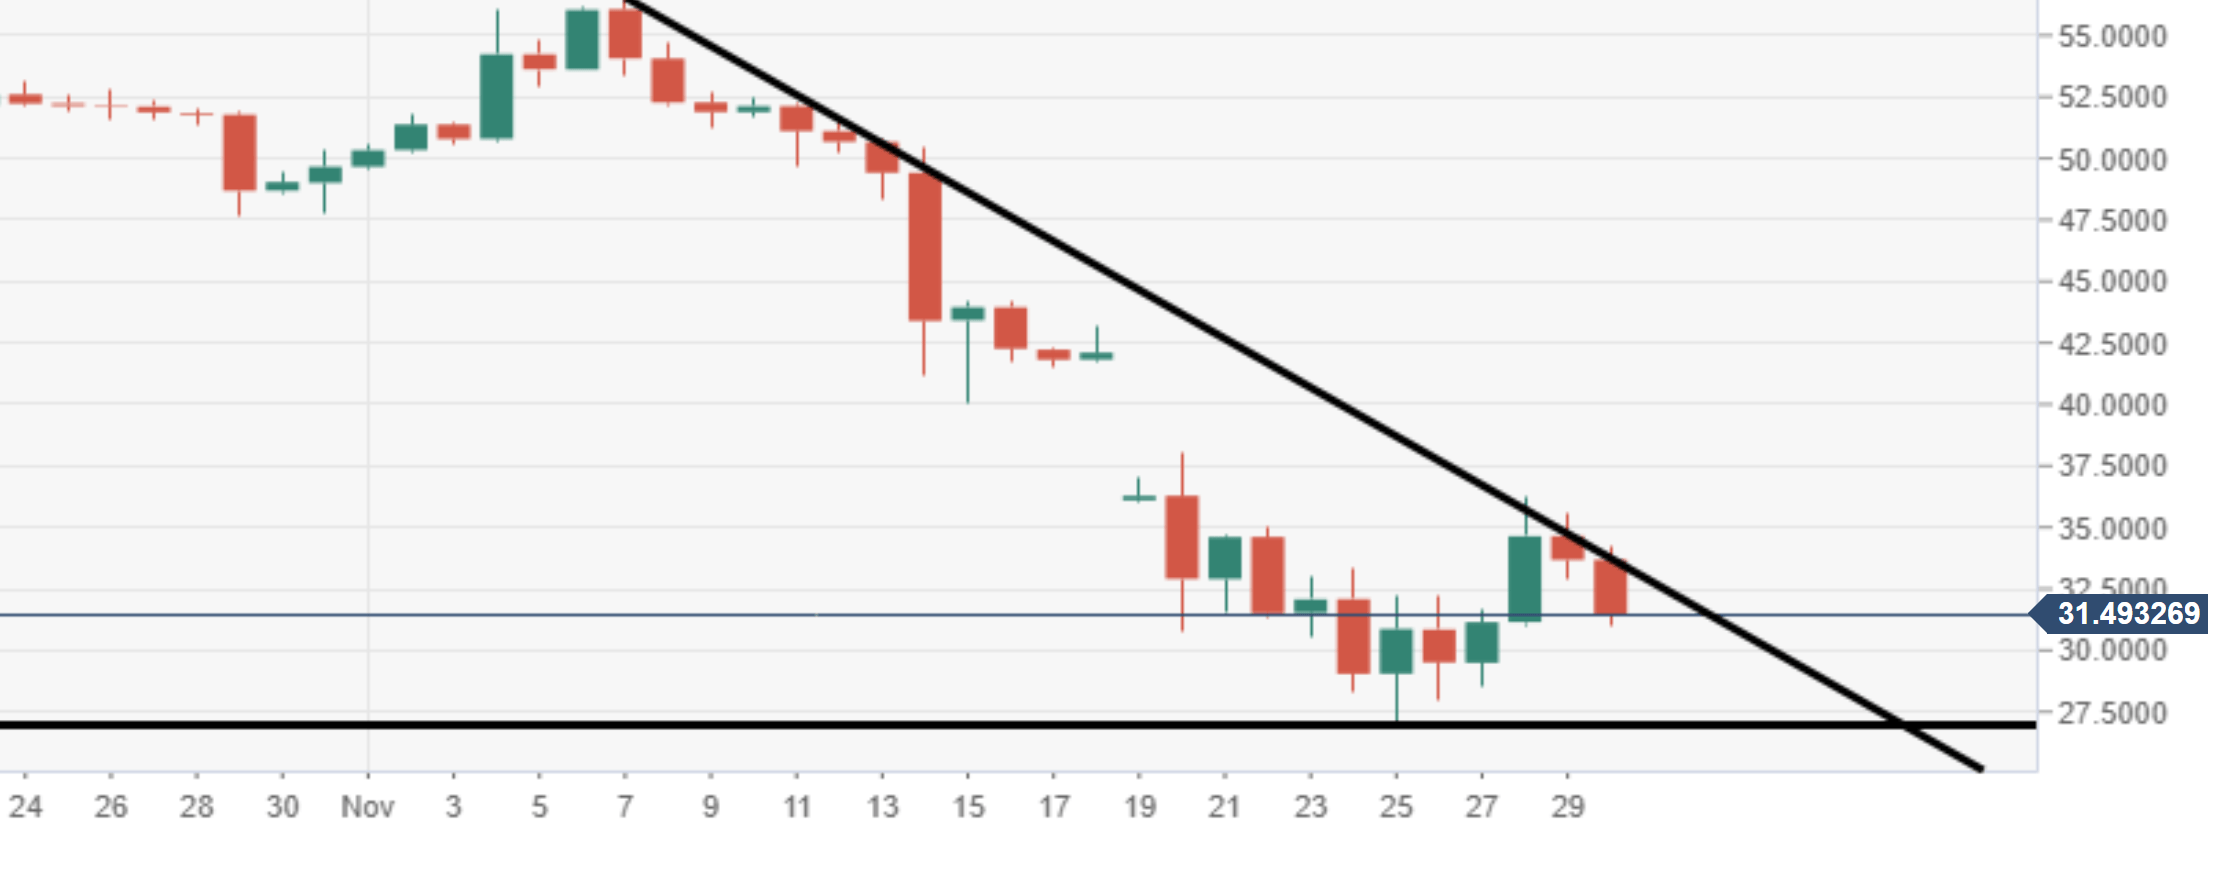
Spot rate: 31.74
Relative change: -5.5%
High: 34.29
Low: 31.04
Trend: Bearish
Support 1: 31.42, daily pivot point support.
Support 2: 29.90, daily pivot point support.
Support 3: 27.13, 25 November low.
Resistance 1: 34.10, descending trend line.
Resistance 2: 35.19, daily pivot point resistance.
Resistance 3: 36.71, daily pivot point resistance.
Author

Ken Chigbo
Independent Analyst
Ken has over 8 years exposure to the financial markets. He started his career as an analyst, covering a variety of asset classes; forex, fixed income, commodities and equities.


