Litecoin Technical Analysis: LTC/USD bears still shaping up for further potential drops
- Litecoin price is nursing deep losses of double-digits in the second of of Thursday's session.
- LTC/USD subject to another drop, near-term bottom eyed at $34.00, a breach could expose $30.00.

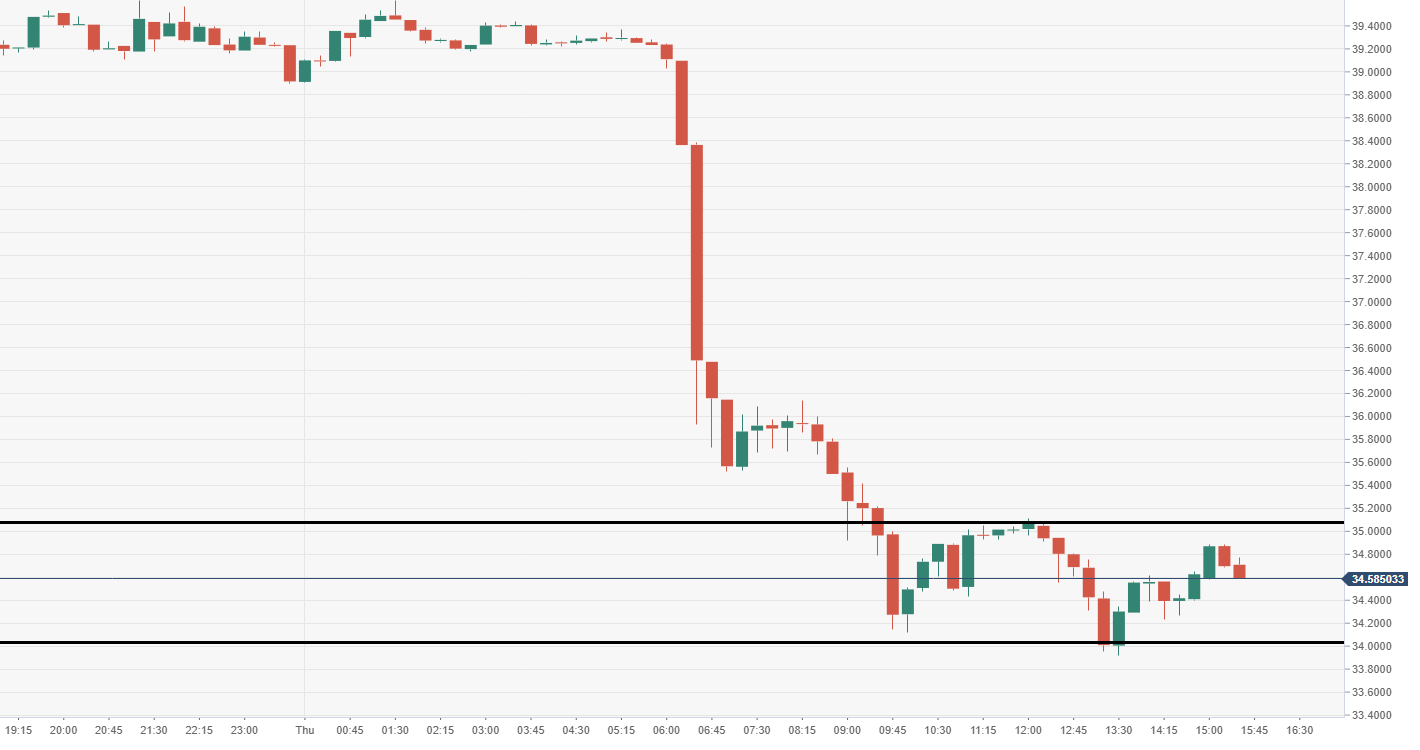
LTC/USD 15-minute chart
- Price action moving within consolidation mode, moving within a narrow range of $35-34, subject to further downside.
Spot rate: 34.53
Relative change: -11.05%
High: 39.62
Low: 33.92
Trend: Bearish
Support 1: 38.26, daily pivot point support.
Support 2: 37.60, daily pivot point support.
Support 3: 36.48, daily pivot point support.
Resistance 1: 40.03, daily pivot point resistance.
Resistance 2: 41.14, daily pivot point resistance.
Resistance 3: 41.80, daily pivot point resistance.
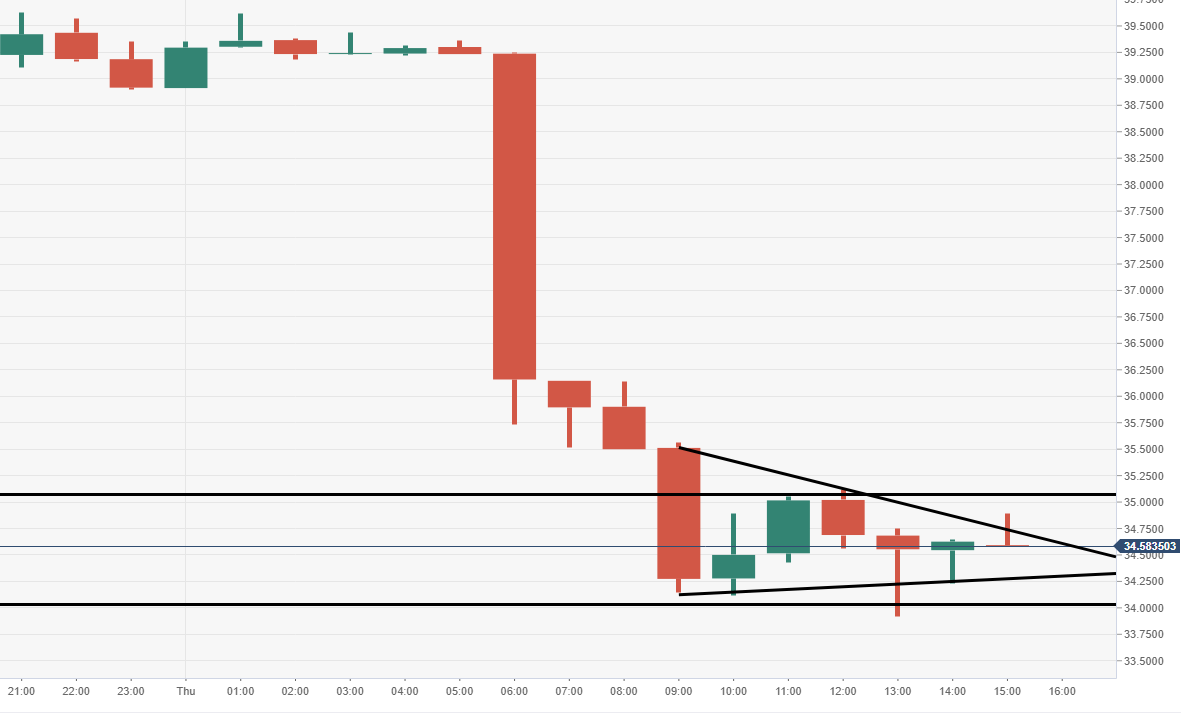
LTC/USD 60-minute chart
- VIa the 60-minute chart view, the price action could be viewed as a near-term potential bearish pennant structure.
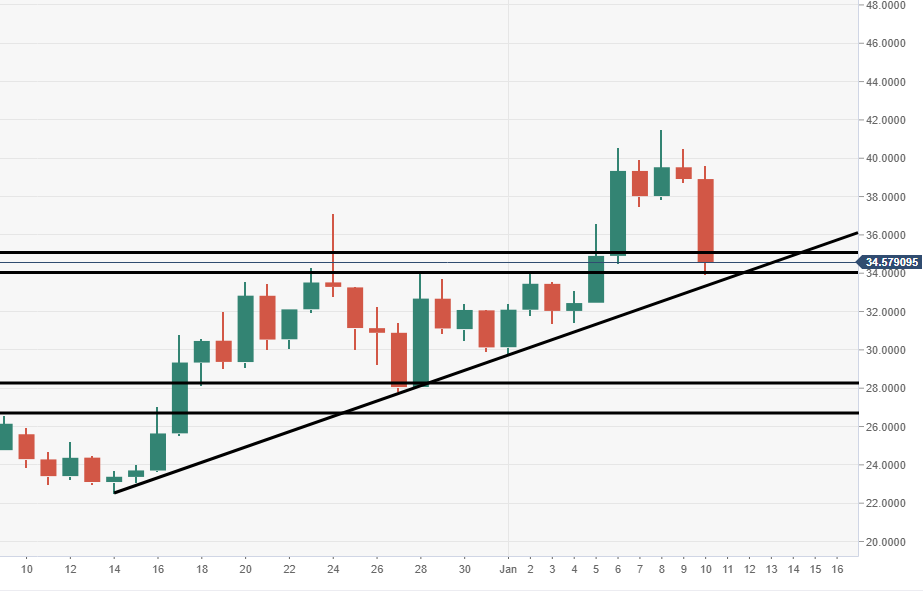
LTC/USD daily chart
- Price gunning towards critical running ascending trend line, which has been in play since 14th December 2018.
Author

Ken Chigbo
Independent Analyst
Ken has over 8 years exposure to the financial markets. He started his career as an analyst, covering a variety of asset classes; forex, fixed income, commodities and equities.


