Litecoin Technical Analysis: LTC/USD bears smash through vital near-term support
- Litecoin price on Wednesday nursing notable losses of 1.80% in the second half of the session.
- LTC/USD near-term price action has smashed through an ascending trend line.

LTC/USD 15-minute chart
- LTC/USD bears smashed through near-term ascending trend line support.
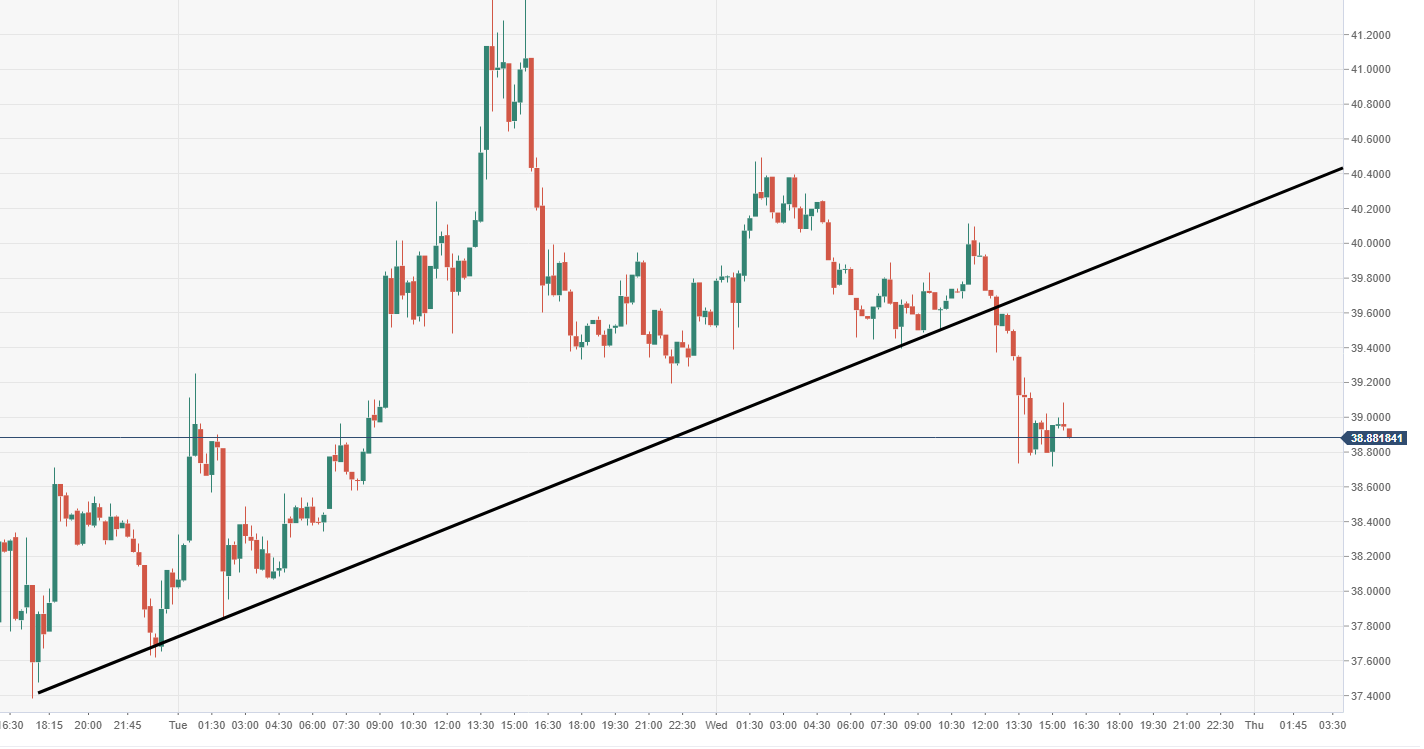
Spot rate: 38.88
Relative change: -1.83%
High: 40.49
Low: 38.71
Trend: Neutral
Support 1: 37.75, daily pivot point support.
Support 2: 35.97, daily pivot point support.
Support 3: 34.09, daily pivot point support.
Resistance 1: 41.40, daily pivot point resistance.
Resistance 2: 43.27, daily pivot point resistance.
Resistance 3: 45.05, daily pivot point resistance.
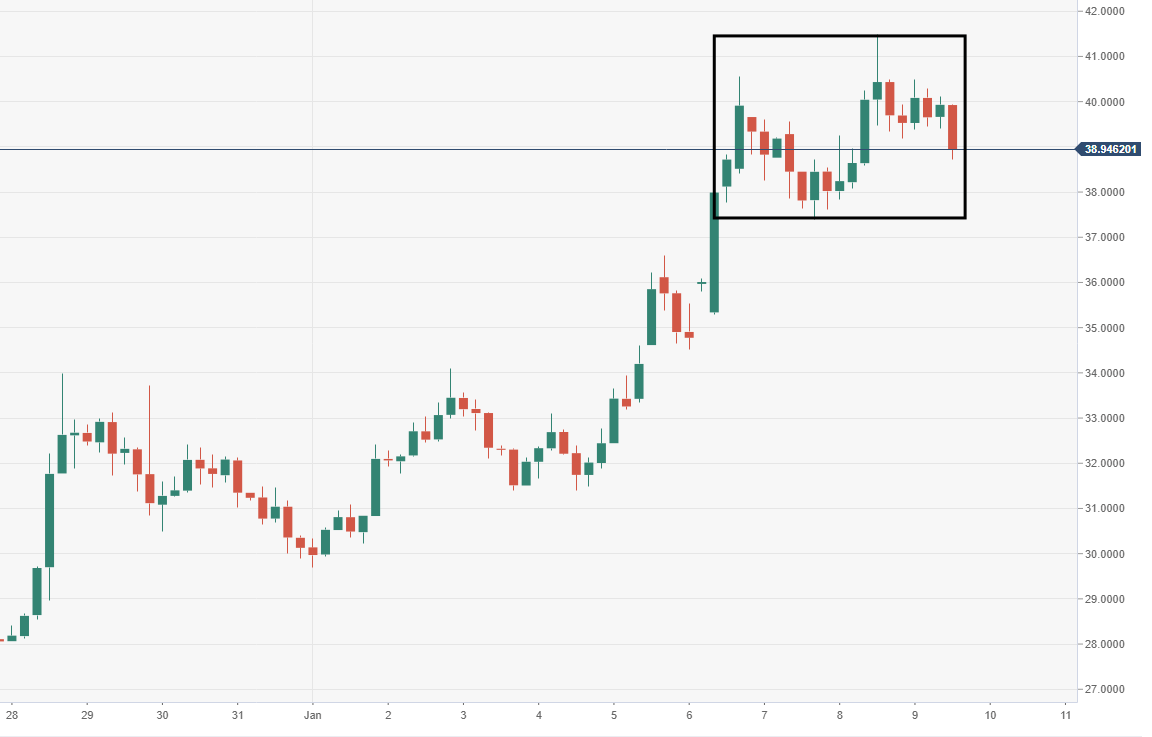
LTC/USD 4-hour chart
- Price action moving within a near-term range-block formation, high at $41.50 low at $37.50.
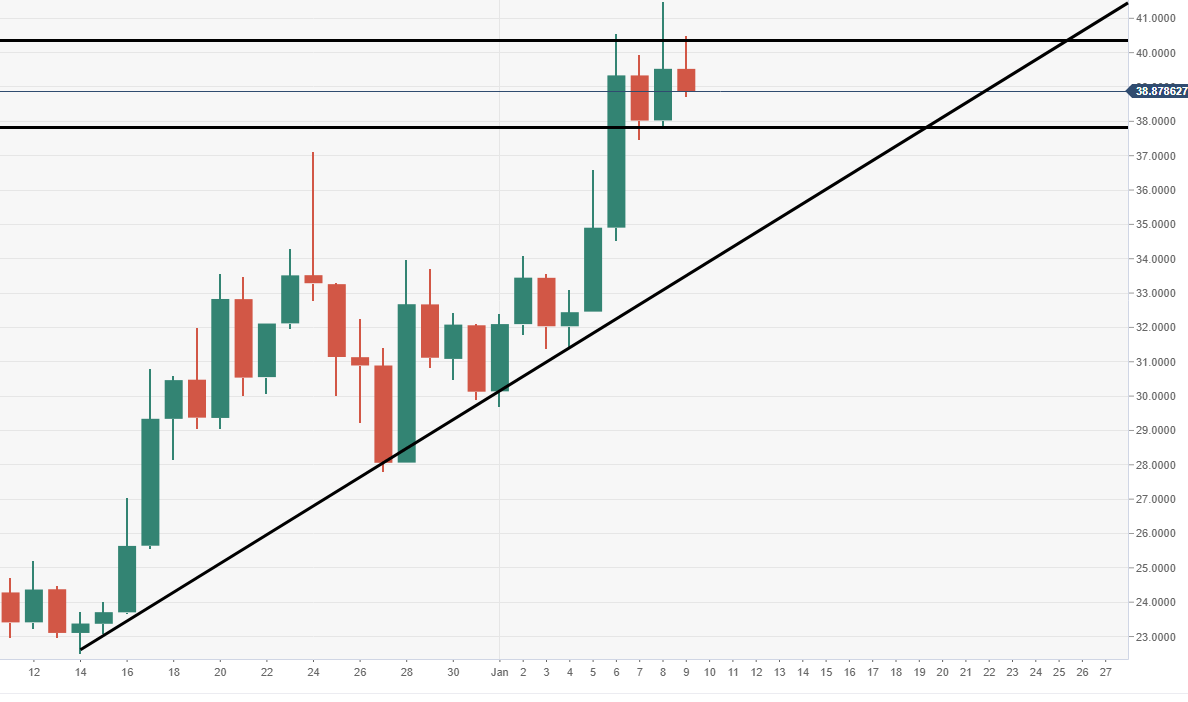
LTC/USD daily chart
- Longer-term price action is supported by a running ascending trend line.
Author

Ken Chigbo
Independent Analyst
Ken has over 8 years exposure to the financial markets. He started his career as an analyst, covering a variety of asset classes; forex, fixed income, commodities and equities.


