Litecoin Price Projection: LTC is preparing to rally another 30%
- Litecoin price pulling back slightly after nearing February high.
- Symmetrical triangle continuation pattern remains live.
- Weekly Relative Strength Index (RSI) no longer overbought.

Litecoin price broke above the upper trend line of the symmetrical triangle on April 3 and has followed through this week, with price coming up just short of the February high at $247.00. The mild pullback near the February high is not unusual and should not be a reason to call the end of the rally categorically.
Litecoin price needs to command higher volume to overcome February high
During a symmetrical triangle pattern, volume often declines, and breakouts tend to be to the upside. In the case of LTC, the upside breakout initially struggled to gain traction, but it has commanded more support this week as volume is near the weekly average with three more days left in the week.
In an FXStreet article on April 1, it was projected that LTC was ready for a 40% gain from the symmetrical triangle breakout level, and that outlook remains the thesis today.
The price action on April 6-7 notes the importance of the February high to the bullish forecast. Traders need to watch for a daily close above the high to confirm the rally will continue to the triangle measured move target of $294.20, producing a gain of 31% from the current price.
Some resistance could unfold at the 61.8% Fibonacci retracement level of the 2017-2018 bear market at $268.03. However, traders should put more emphasis on the 78.6% retracement level at $334.86 due to the price congestion around the level in late 2017.
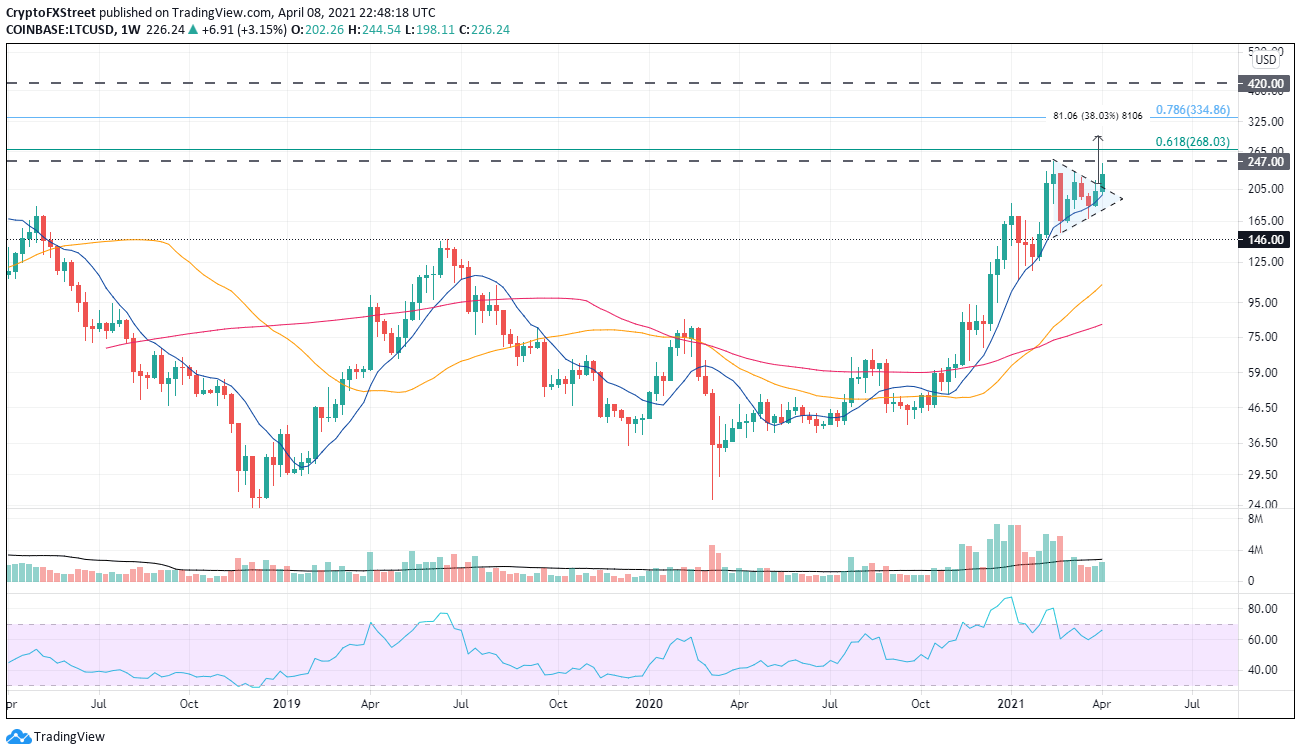
LTC/USD weekly chart
While things appear to be bullish for the Litecoin price, traders need to monitor any further weakness, particularly at a retest of the triangle breakout. A failure to hold will immediately put the 10-week SMA at $197.13 in play, a support level that has held on a closing basis since October 2020. A weekly close below the moving average will invalidate the bullish thesis and expose LTC to a lower triangle trend line test.
If such a scenario comes to fruition, the March low at $167.78 and the February low at $153.07 will be tested.
Author

Sheldon McIntyre, CMT
Independent Analyst
Sheldon has 24 years of investment experience holding various positions in companies based in the United States and Chile. His core competencies include BRIC and G-10 equity markets, swing and position trading and technical analysis.


