Litecoin Price Prediction: LTC stuck between tough resistance and support – Confluence Detector


  • Litecoin settles the dust between critical resistance and support following a 23% surge in two days.
  • The standoff between the bulls and the bears could end if LTC/USD closes the day above $73.8.

Litecoin has slowed down the uptrend that saw it outshine other major altcoins this week. As reported, the 23% spike hit a barrier at $77. A reversal saw LTC embrace critical support around $70 while its immediate upside is capped under $75.

Litecoin could hold in consolidation longer than expected

As discussed earlier, Litecoin tends to lead the altcoin rally in the market by rallying first. If history repeats, LTC might settle for consolidation before breaking out in massive price action, targeting $100.

The 4-hour chart shows the sixth-largest digital asset trading at $72.8 after a minor rejection from $74 (immediate resistance). Support at $70 is likely to sabotage the gradually building bearish momentum. The Relative Strength Index emphasizes the growing sellers’ grip as it dives toward the midline.

LTC/USD price chart

LTC/USD 4-hour chart

Note that the stalemate will be broken if Litecoin closes the day above $75. In the event the price soars towards the monthly high at $77, the $4.8-billion token may rally above $80.

According to the confluence detector tool, Litecoin is sitting on an area with immense support, precisely $73. Various indicators meet here, including the previous 15-minute chart low and the pivot point one-week resistance two.

On the upside, the most robust confluence resistance holds the position at $73.8. This region is home to the Bollinger Band 15-minutes middle curve, the SMA 10 4-hour, and the Fibonacci 61.8% one-day. Trading above this crucial level might ignite another bull-run above $80.

Litecoin will likely hold in the range between the confluences a longer before a breakout comes into the picture. Meanwhile, the most robust support lies at $72.8 and hosts the previous low 15-minutes and the second one-week resistance pivot point.

fxsoriginal

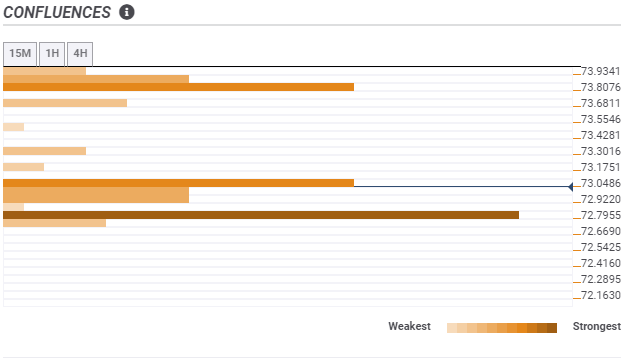
LTC/USD confluence chart

It is worth mentioning that closing below the accelerated trendline (broken line) may encourage more sellers to join the market. In doing so, Litecoin could flip the above support areas into resistance and explore the zone under $70. The 50 SMA on the 4-hour is to provide support and prevent losses to the main trendline (continuous line).


Information on these pages contains forward-looking statements that involve risks and uncertainties. Markets and instruments profiled on this page are for informational purposes only and should not in any way come across as a recommendation to buy or sell in these assets. You should do your own thorough research before making any investment decisions. FXStreet does not in any way guarantee that this information is free from mistakes, errors, or material misstatements. It also does not guarantee that this information is of a timely nature. Investing in Open Markets involves a great deal of risk, including the loss of all or a portion of your investment, as well as emotional distress. All risks, losses and costs associated with investing, including total loss of principal, are your responsibility. The views and opinions expressed in this article are those of the authors and do not necessarily reflect the official policy or position of FXStreet nor its advertisers. The author will not be held responsible for information that is found at the end of links posted on this page.

If not otherwise explicitly mentioned in the body of the article, at the time of writing, the author has no position in any stock mentioned in this article and no business relationship with any company mentioned. The author has not received compensation for writing this article, other than from FXStreet.

FXStreet and the author do not provide personalized recommendations. The author makes no representations as to the accuracy, completeness, or suitability of this information. FXStreet and the author will not be liable for any errors, omissions or any losses, injuries or damages arising from this information and its display or use. Errors and omissions excepted.

The author and FXStreet are not registered investment advisors and nothing in this article is intended to be investment advice.

Join Telegram

Recommended content


Recommended Content

Editors’ Picks

Celebrity meme coins controversy continues amid Pump.fun revenue dominance

Celebrity meme coins controversy continues amid Pump.fun revenue dominance

Pump.fun outperformed the Ethereum blockchain on Tuesday after raking in $1.99 million. Following this achievement, a meme coin based on actress Sydney Sweeney was the subject of controversy after its developers dumped their bags on investors.

More Meme Coins News

PEPE's on-chain metrics indicate potential rally after weeks of silence

PEPE's on-chain metrics indicate potential rally after weeks of silence

PEPE has struggled to see any significant price move after reaching an all-time high in May. Increased adoption rate and low MVRV ratio indicate a bullish run may be on the horizon. A single PEPE outflow from Binance worth $14.7 million gives credence to signs of bullish expectation.

More Pepe News

Ethereum has failed to overcome key resistance despite bullish sentiment surrounding ETH ETF

Ethereum has failed to overcome key resistance despite bullish sentiment surrounding ETH ETF

Ethereum (ETH) is down more than 1.4% on Tuesday following another ETH sale from the Ethereum Foundation. Meanwhile, crypto exchange Gemini's recent report reveals that ETH ETF could see about $5 billion in net inflows within six months of launch.

More Ethereum News

Crypto community blasts Polkadot following report of treasury spending

Crypto community blasts Polkadot following report of treasury spending

Polkadot reports $87 million of treasury spending during H1. Crypto community members expressed harsh feelings toward the DOT team's high spending. DOT is up more than 2% in the past 24 hours but risks correction following the report.

More Polkadot News

Bitcoin: BTC price correction could end in July, according to seasonal data

Bitcoin: BTC price correction could end in July, according to seasonal data

Bitcoin (BTC) price appears poised for a decline this week, influenced by slight outflows in US spot ETFs, selling activity among BTC miners, and a combined transfer of 4,690.28 BTC to centralized exchanges by the US and German governments.

Read full analysis

BTC

ETH

XRP