![]() Sheldon McIntyre, CMT
Sheldon McIntyre, CMT
Independent Analyst
- Litecoin price gains 15.77% for the best daily gain since January 3.
- Daily Relative Strength Index (RSI) not showing a bearish momentum divergence.
- Swiss SIX exchange-traded product, LITE, increases spotlight on LTC.
Litecoin price successfully broke out from a symmetrical triangle pattern on April 5 with a 9.5% gain. It printed a new rally high today at $262.98, just short of the 61.8% Fibonacci retracement of the 2017-2018 bear market at $268.06. The bullish LTC thesis sees higher levels moving forward.
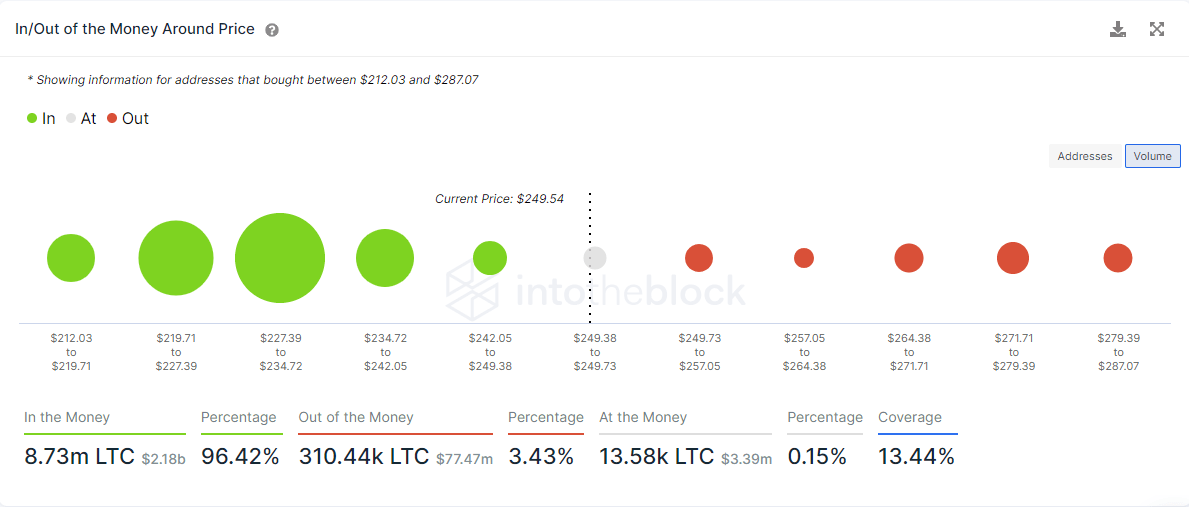
Litecoin price faces limited resistance based on IOMAP figures
The successful retest of the triangle breakout on April 7 was a clear signal to speculators that LTC was primed to test the 2021 high at $247.00. Yesterday’s daily close above the February high was a new signal to speculators that LTC’s 2021 rally was set to continue.
The IntoTheBlock In/Out of the Money Around Price (IOMAP) data exposes almost no resistance between $249.73 and $287.07, projecting a test of the symmetrical triangle measured move target of $292.20. Conversely, there is a significant source of support between $227.39 and $234.72, where 69.91k addresses bought 4.17 million LTC.
ETH IOMAP chart
In an FXStreet article on April 1, it was projected that LTC was ready for a 40% gain from the symmetrical triangle breakout level, and that outlook remains the thesis today.
Some resistance may occur at the 61.8% retracement of the 2017-2018 bear market at $268.06, but IOMAP data indicate that the opposition will be short-lived. Instead, the current bullish outlook targets $292.20 as a valid profit target, a gain of 38%. There is a chance that the rally will reach the 78.6% retracement at $334.88 if volume underpins the rally.
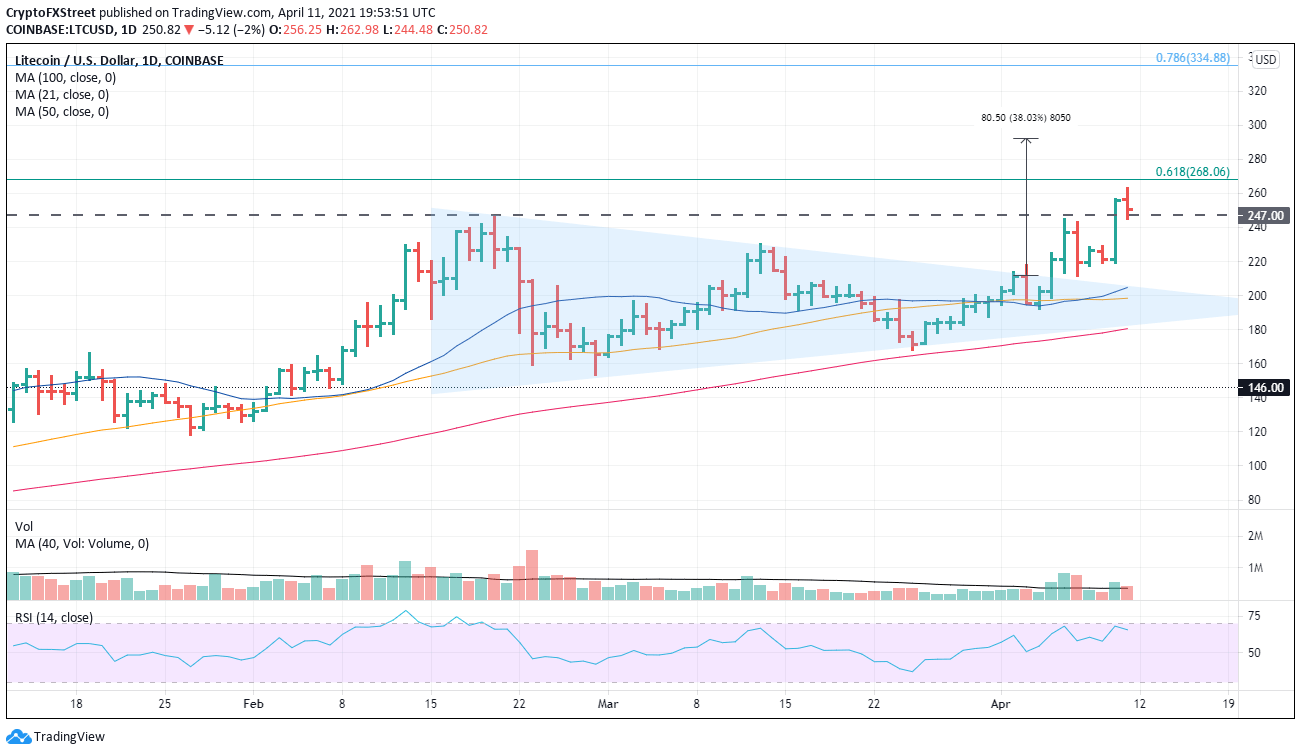
LTC/USD daily chart
Yes, the technicals and the data paint a bullish picture, but things could change very quickly, maybe sparked by a general sell-off in the cryptocurrency complex. If that occurs, downside targets are the 21-day simple moving average (SMA) and the 50-day SMA at $204.77 and 198.45, respectively.
Speculators should mark the convergence of the triangle’s lower trend line at $181.90 and the 100-day SMA at $180.61 as the next level of support.
Note: All information on this page is subject to change. The use of this website constitutes acceptance of our user agreement. Please read our privacy policy and legal disclaimer. Opinions expressed at FXstreet.com are those of the individual authors and do not necessarily represent the opinion of FXstreet.com or its management. Risk Disclosure: Trading foreign exchange on margin carries a high level of risk, and may not be suitable for all investors. The high degree of leverage can work against you as well as for you. Before deciding to invest in foreign exchange you should carefully consider your investment objectives, level of experience, and risk appetite. The possibility exists that you could sustain a loss of some or all of your initial investment and therefore you should not invest money that you cannot afford to lose. You should be aware of all the risks associated with foreign exchange trading, and seek advice from an independent financial advisor if you have any doubts.
Recommended Content
Editors’ Picks

Is Altcoin Season here as Bitcoin reaches a new all-time high?
Bitcoin reaches a new all-time high of $98,384 on Thursday, with altcoins following the suit. Reports highlight that the recent surge in altcoins was fueled by the victory of crypto-friendly candidate Donal Trump in the US presidential election.

Shanghai court confirms legal recognition of crypto ownership
A Shanghai court has confirmed that owning digital assets, including Bitcoin, is legal under Chinese law. Judge Sun Jie of the Shanghai Songjiang People’s Court shared this opinion through the WeChat account of the Shanghai High People’s Court.
BTC hits an all-time high above $97,850, inches away from the $100K mark
Bitcoin hit a new all-time high of $97,852 on Thursday, and the technical outlook suggests a possible continuation of the rally to $100,000. BTC futures have surged past the $100,000 price mark on Deribit, and Lookonchain data shows whales are accumulating.
Shiba Inu holders withdraw 1.67 trillion SHIB tokens from exchange
Shiba Inu trades slightly higher, around $0.000024, on Thursday after declining more than 5% the previous week. SHIB’s on-chain metrics project a bullish outlook as holders accumulate recent dips, and dormant wallets are on the move, all pointing to a recovery in the cards.
Bitcoin: New high of $100K or correction to $78K?
Bitcoin surged to a new all-time high of $93,265 in the first half of the week, followed by a slight decline in the latter half. Reports highlight that Bitcoin’s current level is still not overvalued and could target levels above $100,000 in the coming weeks.

Best Forex Brokers with Low Spreads
VERIFIED Low spreads are crucial for reducing trading costs. Explore top Forex brokers offering competitive spreads and high leverage. Compare options for EUR/USD, GBP/USD, USD/JPY, and Gold.