• LTC is up by more than 11% in the past 24 hours after the PayPal announcement to support cryptocurrencies
  • The digital asset has climbed above several resistance levels and faces very little resistance. 

The entire market capitalization has jumped by around $20 billion in the past 24 hours. PayPal has finally stated that it will indeed support the use of cryptocurrencies like BTC, ETH, BCH, and LTC to buy from more than 26 million merchants around the world.

PayPal is by far one of the biggest global payment providers with around 340 million active accounts. Litecoin had a positive reaction to the news, increasing its market cap by close to $400 million in less than 18 hours. 

LTC eying up $64 with very little resistance ahead

After the massive 11% price explosion in the past 24 hours, the price of LTC has smashed through several resistance levels on the daily chart. Bulls are in full control now establishing a robust daily uptrend and looking for more gains in the near future.

LTC/USD daily chart

ltc price

The digital asset has climbed above the 50-SMA and the 100-SMA, which hasn’t happened since September 12. Looking at the daily chart, we can observe basically no real resistance levels until $64, which means that a continuation bull move can easily drive the price of LTC towards that point.

LTC IOMAP Chart

ltc price

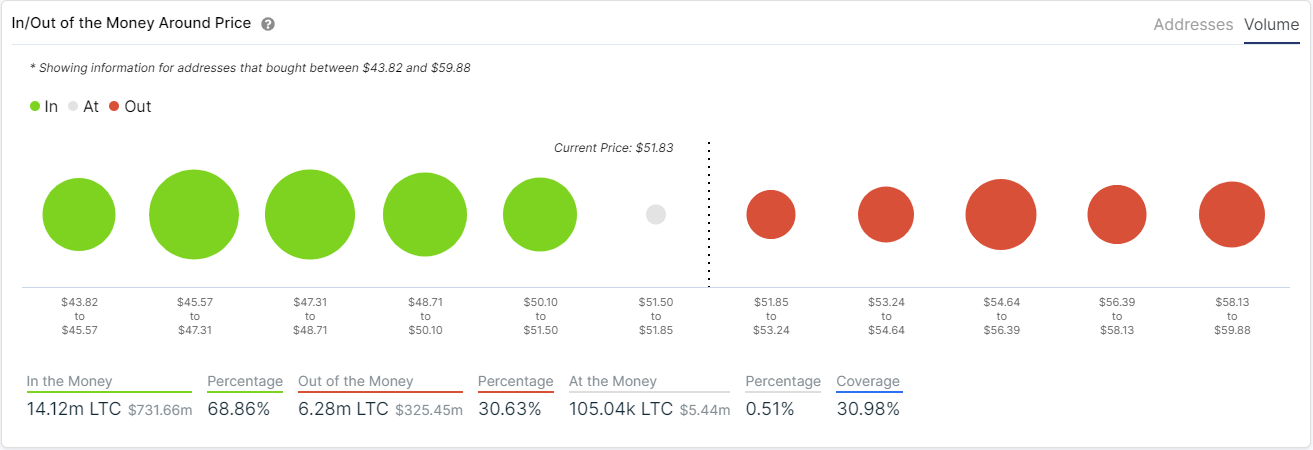
The In/Out of the Money Around Price chart shows a similar story. Although there are some resistance areas before $64, the support we see below is far stronger in comparison. It seems that one of the strongest areas would be between $54.6 to $56.3 with a volume of 1.93 million Litecoin.

LTC/USD 12-hour chart

ltc price

Not much can stop Litecoin at this point, however, the 12-hour chart shows an overextended RSI which could pose a threat to the bulls in the short-term. We could potentially see a brief pullback down to $50 as a re-test of the psychological level.

Key price points for Litecoin investors

Due to the massive news announced by PayPal about supporting cryptocurrencies, the entire market is heavily bullish. Many indicators, although bearish, will most likely not stop the digital asset from climbing further. 

A continuation move of the current bullish momentum can easily drive LTC up to $64 as there is very little resistance to the upside shown by the IOMAP chart. On the other hand, rejection from the overextended RSI on the 12-hour chart could send Litecoin towards the psychological level at $50.


Note: All information on this page is subject to change. The use of this website constitutes acceptance of our user agreement. Please read our privacy policy and legal disclaimer. Opinions expressed at FXstreet.com are those of the individual authors and do not necessarily represent the opinion of FXstreet.com or its management. Risk Disclosure: Trading foreign exchange on margin carries a high level of risk, and may not be suitable for all investors. The high degree of leverage can work against you as well as for you. Before deciding to invest in foreign exchange you should carefully consider your investment objectives, level of experience, and risk appetite. The possibility exists that you could sustain a loss of some or all of your initial investment and therefore you should not invest money that you cannot afford to lose. You should be aware of all the risks associated with foreign exchange trading, and seek advice from an independent financial advisor if you have any doubts.

Join Telegram

Recommended content


Recommended Content

Editors’ Picks

Ripple on-chain metrics show bullish signs amidst legal struggle with SEC, XRP eyes recovery

Ripple on-chain metrics show bullish signs amidst legal struggle with SEC, XRP eyes recovery

Ripple made a comeback above $0.48 on Tuesday and hovers above that level in Wednesday’s European session. Ripple on-chain metrics such as transaction volume and Network Realized Profit/Loss have turned bullish, supporting a recovery in the altcoin. 

More Ripple News

Bitcoin price falls amidst German government transfers, miners activity

Bitcoin price falls amidst German government transfers, miners activity

Bitcoin (BTC) extends correction on Wednesday and hovers around $61,000 after finding resistance near the $64,000 level on Monday. Recent on-chain data indicates heightened selling activity from Bitcoin miners early in the week. 

More Bitcoin News

Crypto Today: Bitcoin erases gains from end of June, Ethereum declines while Ripple holds

Crypto Today: Bitcoin erases gains from end of June, Ethereum declines while Ripple holds

Bitcoin wipes out gains from the last week of June and falls below $60,000 on Wednesday. Ethereum and top altcoins ranked by market capitalization erased gains as the inflation outlook worsened. Ripple holds on to recent gains and hovers above $0.48 on Wednesday. 

More Cryptocurrencies News

Three reasons why altcoins could shake off losses this week

Three reasons why altcoins could shake off losses this week

On-chain data from Santiment shows that altcoins are currently in the opportunity zone, or generating buy signals. The top three altcoins in the buy zone are Basic Attention Token (BAT), Chromia (CHR), and Highstreet (HIGH), per Santiment. 

More Altcoins News

Bitcoin: BTC price correction could end in July, according to seasonal data

Bitcoin: BTC price correction could end in July, according to seasonal data

Bitcoin (BTC) price appears poised for a decline this week, influenced by slight outflows in US spot ETFs, selling activity among BTC miners, and a combined transfer of 4,690.28 BTC to centralized exchanges by the US and German governments.

Read full analysis

BTC

ETH

XRP